
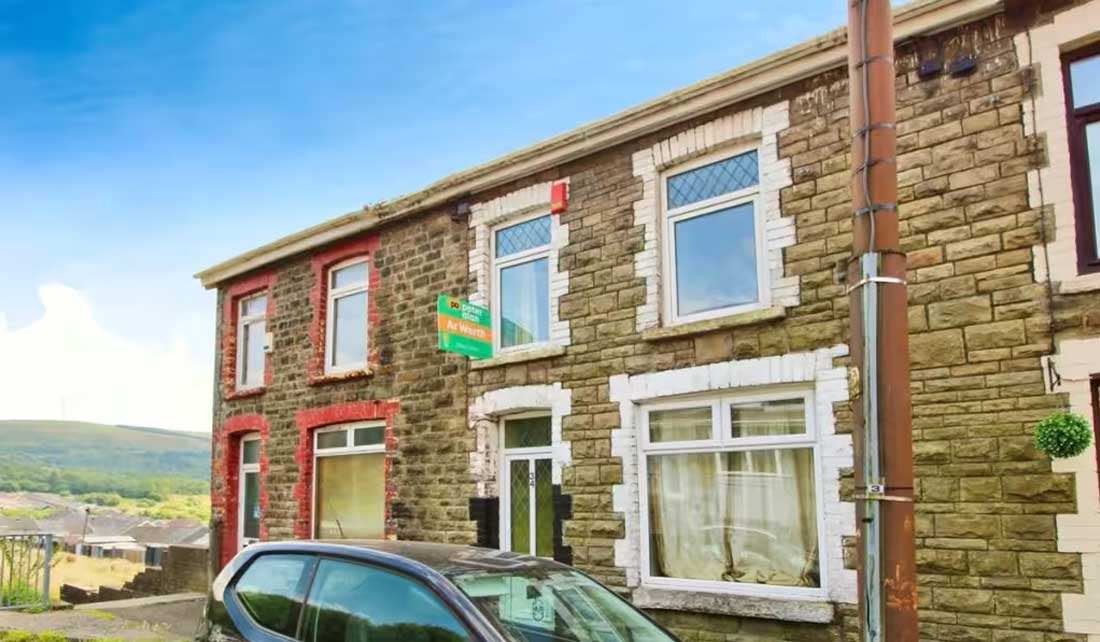
Homeowners live in homes for 9 years before upping sticks
Londoners stay put the longest before going on the market, while those in the North up sticks faster. Find out what's happening where you live.
UK homeowners are staying put in their homes for an average of 9 years before moving out.
In the last 18 months, 33% of homes were re-sold after their owners had lived in them for between 3 to 7 years.
The tripling of mortgage rates, fire safety issues and pandemic lifestyle changes, alongside personal reasons, are the key motivating factors behind people upping sticks to somewhere new.
Over half of sellers move within ten years

When looking at the distribution of time between moves, we find two peaks in activity, involving sellers who bought between 2005-7, and sellers who bought 3-6 years ago.
The first bump in sales activity comes from people who bought their home just before the Global Financial Crisis back in 2007.
This trend is more distinct in northern England, where house prices took longer to recover from the crisis. It took until 2017 for these homes to reach their pre-crisis price levels.
Since then, the equity gains homeowners have made has helped them to unlock their next move.
The more recent peak coincides with purchases following the Brexit referendum, as well as during the Covid pandemic.
Home moving decisions since then have been influenced by pandemic-driven re-assessment of home needs, fire safety issues and affordability challenges triggered by tripling mortgage rates
Those in smaller homes move 4 years earlier on average
Homeowners in smaller homes with one or two bedrooms tend to outgrow them quickly and don’t typically stay as long in their homes (just 9 years versus 13 years for those in larger homes).
These property types are popular among singles and young families with fast-evolving home needs who are more likely to upsize earlier than more established families.
Average number of years between sales by property size and region
|
Region |
One & two bed |
Three Bed |
Four plus bed |
|
Scotland |
7 |
7 |
8 |
|
Wales |
8 |
8 |
9 |
|
East Midlands |
8 |
8 |
9 |
|
East of England |
8 |
9 |
10 |
|
London |
9 |
11 |
12 |
|
North East |
8 |
8 |
9 |
|
North West |
9 |
9 |
9 |
|
South East |
8 |
9 |
11 |
|
South West |
8 |
9 |
9 |
|
West Midlands |
8 |
8 |
10 |
|
Yorkshire and The Humber |
9 |
8 |
9 |
Those in more affordable regions are also more likely to move sooner.
This is evident in Scotland and the North East, two of the most affordable regions of the UK where homes cost on average £166,500 and £146,000.
Over a quarter (28 per cent) of homeowners in these regions are more likely to sell within just five years of purchasing their home.
While mortgage rate increases have had a less pronounced effect in more affordable regions, the overall cost of moving tends to be lower in these areas making the prospect of selling more attractive for would-be movers.
Sellers in more affordable areas sell earlier

Urbanites stay put for longer
Londoners who sold in the last 18 months stayed in their home for the longest compared to other UK regions, an average of 10 years.
This is most likely due to higher house prices and higher moving costs.
Stamp duty rates in the capital are higher than anywhere else in the country, costing the average Londoner £14,230. This goes up to 15 years in Barking and Dagenham - the largest average in the country.
Elsewhere in England, we find that homeowners in areas with small towns and villages like Mid Devon, Harborough and Swale sell after the shortest amount of time, just eight years on average.
In Scotland, those living in the main cities of Glasgow and Edinburgh, as well as larger towns in southern parts of Scotland move most often, on average every seven years.
Two cohorts of sellers have dominated the market over the last 18 months - those who bought just before the Global Financial Crisis and those who bought just before or during the pandemic.
Their decisions to move have been influenced not just by personal needs, but also equity gains, affordability and buying costs.
As the market continues to settle in 2025, those considering selling should get in touch with local agents to understand the value of their current home, what demand for a home like theirs looks like and what they can afford to buy.
Key takeaways
- There have been two bumper crops of sales in the last 18 months, largely from sellers who bought just before the Global Financial Crisis in 2007 and those who bought just before or during the pandemic 2019
- Homeowners in flats are selling quicker than those in houses, with apartments going back on the market after 9 years, while houses return after 13 years
- Sellers in more affordable areas such as Scotland and the North East are most likely to sell within five years of purchasing their home, with lower moving costs unlocking more moves in cheaper parts of the UK
- But Londoners stay put for the longest: most sellers in the capital who sold in the last 18 months had lived in their homes for 10 years
What are Britain's most affordable towns?
We've taken a look at the latest house-value-to-household-earnings ratios across Britain to work out where you can get the most bang for your buck.
The average house is valued at 3.79x the household income
House prices vary across a country, but so do local earnings. Comparing prices with earnings helps illustrate relative affordability in the area, highlighting more and less accessible markets.
Nationally, an average house value is 3.79x the average annual household income. And the good news is that this has improved by 3.7% in the last year as earnings grew more than house prices.
Values of homes in Britain range between just over 1x the average household income in Cumnock, Scotland, to 12.43x in Beaconsfield, Buckinghamshire.
More buyers will be able to buy in the areas with lower value-to-earnings ratios. On the other hand, a high house-value-to-earnings ratio makes buying more challenging for local families, with higher deposits and above-average incomes needed to obtain a mortgage.
Let’s take a look at the most accessible locations for local buyers.
The most affordable towns are in Scotland and North East England
While the average house-value-to-earnings ratio is 3.79 in Britain, there are many areas across the country where this ratio is much lower. This makes homes significantly more affordable to buy.
Ayrshire in South West Scotland has a particularly high concentration of affordable towns. We found that 4 out of 5 of Britain’s most affordable towns to buy are in this area: Cumnock, Girvan, Saltcoats and Ardrossan. The average home in the area is valued at up to 1.26x the annual household income in the area.
The most affordable locations to buy in England are Shildon and Peterlee, both in County Durham, and Ashington in Northumberland. Homes in these towns are valued at less than 1.4x the local household income.
Southern England shows a positive change in affordability
Over the last year, we have recorded the largest improvement in affordability in southern parts of the country, as measured by value-to-earning ratios.
As house prices fell in two thirds of southern markets (excluding London), the house-value to earnings ratios improved by almost 5% in the South East, South West and East of England.
However, affordability remains a challenge for many looking to buy in the area. We found that homes in 8 out of 10 towns are typically valued at more than 4x the average household income.
Wisbech in Cambridgeshire, as well as the coastal towns of Dover in Kent and Great Yarmouth in Norfolk are the most affordable places to buy in the south of the country. House-value-to-earnings ratios in these areas ranges between 2.96 and 3.16.
The North-South divide in affordability continues
In Scotland, 88% of towns have a house-value-to-earnings ratio below 3. In contrast, there is only one town in southern England where houses are valued at less than 3x local household earnings: Wisbech in Cambridgeshire.
These stark differences illustrate a large gap in buyers’ affordability across Great Britain.
3% of Britain’s towns have a value-to-earnings ratio that exceeds 7, and most of those are within 15 miles of M25. This illustrates how London’s affordability challenges are now spilling over into the most desirable commuter towns.
Most affordable options for Londoners
In London, Croydon has the lowest value-to-earnings ratio of 4.69. Greenwich, as well as Barking and Dagenham also have homes valued at less than 5x the average local household income.
Those looking to get more bang for their buck may want to consider buying in a commuter town. We found 33 towns within an hour’s train journey to London that have lower value-to-earnings ratios than Croydon. The most affordable ones are Chatham (3.65), Southend (3.86) and Basingstoke (3.89).
Key takeaways
- The average house is valued at 3.79x the average annual household income
- Cumnock in East Ayrshire is Britain’s most affordable town to buy in 2024
- The most affordable town to buy in England is Shildon in County Durham
- House value-to-earnings ratios improve the most in southern England, but 8 in 10 towns are still valued at more than 4x the local household incomes
- Wisbech is the most affordable town to buy in southern England
What does the Autumn Budget mean for the housing market?
Second home stamp duty raised to 5% from tomorrow, but relief for first-time buyers and home movers remains until April 2025. Capital Gains Tax increased and thousands of affordable homes to be built. How the Autumn Budget impacts the housing market.
In Labour’s first budget for 14 years, the country’s first female Chancellor, Rachel Reeves, emphasised she’d inherited a ‘dire’ situation from the Conservatives and had to make difficult choices to fix the foundations for the UKs economy.
Overall, taxes were raised by £40 billion, the upper end of what economists had predicted. The bulk of the money raised will come from National Insurance contributions paid by employers, which will make up £25 billion of the total.
Further revenue will be raised by Capital Gains Tax, closing inheritance tax loopholes and increases in stamp duty for second home buyers, which will raise a further £9 billion.
So what does it all mean for the housing market?
Stamp duty on additional homes raised from 3% to 5%
From tomorrow, people buying an additional home will need to pay an extra 2% of the entire property cost in stamp duty.
Second-home stamp duty rates today are currently 3%, meaning buyers pay an additional 3% of the entire value of the property on top of any standard stamp duty that's payable.
But from tomorrow, that 3% rate rises to 5%.
So, the new stamp duty bands will be:
For the portion between £0 - £250,000 - 5% stamp duty
For the portion between £250,000 - £925,000 - 10% stamp duty
For the portion between £925,00 - £1.5m - 15% stamp duty
For the portion above £1.5m - 17%
The move is likely to unsettle property investors, in a market where many landlords are already selling and 12.5% of homes currently for sale are former rental properties.
This is reducing the amount of rented accommodation available to renters, causing competition for homes and in turn pushing up the cost of renting.
Our Executive Director of Research, Richard Donnell, says: ‘The private rented sector has seen static supply since tax changes were introduced in 2016. There is a steady net selling by landlords in response to changes in tax policies, alongside greater regulation of housing and higher mortgage rates.
‘We need to keep as many landlords as possible in the market to provide choice for renters who are currently facing limited options. Rents rising faster than earnings is hitting those on the lowest incomes the hardest.’
Reeves said this increase has been made to support people buying their first home or moving home, and kept the current raised stamp duty threshold in place for first-time buyers and home movers until April 2025.
Stamp duty threshold held for first-time buyers and home movers until April 2025
First-time buyers will continue to benefit from a raised stamp duty threshold until April 2025, meaning they won’t have to pay any stamp duty on properties costing up to £425,000.
However, from next April, the stamp duty threshold will be lowered to £300,000.
For now, for properties costing between £425,000 and £625,000, first-time buyers will need to pay 5% tax on that particular portion of the property. And for properties costing over £625,000, normal stamp duty rates apply.
But from April 2025, first-time buyers will need to pay stamp duty of 5% on the portion of the property between £300,000 to £500,000.
For home movers selling their home to buy their next home, the stamp duty threshold of £250,000 also remains in place until April 2025:
For homes costing over £250,000 you'll need to pay 5% on the portion up to £925,000.
For homes costing over £925,000, you'll need to pay 10% on the portion up to £1.5m.
And for homes costing over £1.5m, you'll need to pay 12% on the portion over £1.5m.
However from April 2025, the stamp duty threshold for home movers will be lowered to £125,000 and 2% stamp duty will need to be paid on the portion between £125,000 and £250,000.
Capital Gains Tax increased but rates on property left untouched
Capital Gains Tax is the tax charged on profits made from the sale of assets, including second homes.
Today the chancellor increased Capital Gains Tax for lower rate taxpayers (those earning under £50,270 a year) from 10% to 18% and the rate for higher rate taxpayers (those earning over £50,270) from 20% to 24%.
However, the rates on residential property sales will remain at 18% and 24%.
‘This means the UK will still have the lowest capital gains tax rate of any European G7 economy,’ said Reeves.
Inheritance tax rules for property held until 2030
The inheritance tax rules for property will remain the same until 2030.
Currently the first £325,000 of a property’s value can be inherited tax-free. This rises to £500,000 if the property is passed on to direct descendants: children and grandchildren.
And £1 million if a property is passed onto a spouse and then inherited by direct descendants.
However, the inheritance tax rules are set to change when it comes to inherited pensions from April 2027, when unused pension funds and death benefits will be included within the value of a person’s estate for inheritance tax purposes.
£500 million for affordable housing
Reeves announced £500 million for affordable housing as part of a package worth £5 billion to deliver 33,000 new homes, boost supply and support small housebuilders.
Several sites across the country have already been earmarked for development, including Liverpool Docks, where 2,000 new homes are to be built, and Cambridge, 'to help realise its full growth potential'.
The government also plans to increase the supply of affordable housing by reducing Right to Buy discounts so that more council homes remain within the sector.
In a statement, the government said England’s existing social housing supply is ‘depleted every year by the Right to Buy scheme, while also disincentivising councils to build new social housing’.
Local authorities can now retain full receipts from transactions so that the money can be reinvested back into housing stock.
Donnell says: ‘The Budget focus on housing is rightly on the long term plan to grow housing supply and inject funds to support more affordable homes alongside a much needed rent settlement for social housing providers.
‘Many of the pressures in the housing market come from a lack of supply or not enough of the right kind of homes, so growing supply is a top priority but it is far from a quick fix.
‘The housing market needs long term solutions that lead to a better market for all over 5, 10 and 20 years. Growing supply is the no 1 priority and this needs a multi pronged approach, which involves much more than simply adding a bit more money to the affordable housing program.’
Dangerous cladding
Following the Grenfell Tower fire in 2017, Reeves also pledged £1 billion of investment to remove dangerous cladding from high rise apartment blocks next year.
Key takeaways
- Stamp duty increased to 5% on second homes
- Higher stamp duty thresholds remain in place for first-time buyers and home movers until April 2025, but are set to be lowered after then
- Capital Gains Tax increased but rates on residential property sales to remain at 18% and 24%
- £500 million pledged for affordable housing

What does the Autumn budget mean for household budgets?
How does Rachel Reeves's Autumn Budget affect household budgets? As the minimum wage rises to £12.21 an hour, National Insurance is frozen for employees and pensions increased, let's take a look.
‘On July 4 the country voted for change,’ said Chancellor Rachel Reeves in the UK’s first Labour budget in 14 years.
‘And change must be felt through more money in people’s pockets, an NHS that is there when you need it and through an economy that is growing, creating wealth and opportunity for all, because that is the only way to improve living standards.’
Reminding people that it was a Labour government that rebuilt Britain from the rubble of the Second World War in 1945, Reeves added: ‘Today, it falls to this Labour government to rebuild Britain once again.’
In the first budget in our country’s history to be delivered by a woman, Reeves commented: ‘I’m deeply proud to be Britain’s first ever female Chancellor of the Exchequer. To girls and young women everywhere, let there be no ceiling on your ambition, your hopes and your dreams.’
Adding that Labour had a responsibility to pass on a fairer society and a stronger economy to the next generation of women.
Of the last Conservative government, Reeves said: ‘Their austerity broke our NHS, their Brexit deal harmed British business and their Mini budget left families paying the price for higher mortgages.’
All of which left ‘a black hole in the British finances and public services on their knees.’
Reeves said there was a £22 billion black hole in the public finances which showed hundreds of under-funded pressures in the public finances, adding: ‘Never again will we allow a government to play fast and loose with the public finances.’
Outlining a plan to implement in full the 10 recommendations from the OBR, Reeves planned to tackle ‘inherited broken public finances and services too,’ which included:
-
NHS waiting lists at record levels
-
Children in Portakabins as school roofs crumble
-
Trains that don’t arrive
-
Prisons overflowing
-
Criminals who are not punished.
She also outlined ‘vital compensation schemes for victims of two terrible injustices: the infected blood scandal and the Post Office horizon scandal,’ with £11.8bn outlined for victims of the infected blood scandal and £1.8bn for the victims of the Post Office Horizon scandal, which were ‘long overdue for the pain and injustice people have suffered.’
In a budget designed to raise taxes by £40bn, Reeves pledged to ‘rebuild our public services’ while maintaining the Bank of England’s 2% inflation target, reducing borrowing and enabling real GDP growth, predicted to reach 1.6% by 2029.
Government savings
Reeves pledged to set a 2% savings target for all government departments to meet next year.
She also appointed a Covid Corruption Commissioner to uncover the companies that used a national emergency to line their own pockets.
And outlined plans for a crackdown on fraud in the welfare system, which is ‘often the work of criminal gangs’.
Counter fraud teams will be appointed to prevent illegal activity alongside new legal measures - including direct access to bank accounts to recover debt - which is intended to raise £4.3bn.
Tax and the cost of living
To ensure people pay what they already owe, Labour plan to modernise HMRC’s systems, cracking down on umbrella companies that exploit workers, while going after promoters of tax avoidance schemes. This will raise £6.5bn for the treasury.
Minimum wage rises to £12.21 an hour
‘Family finances are stretched and paychecks don’t go as far as they once did,’ said Reeves. ‘Today we are supporting people with the cost of living.’
Labour introduced the national minimum wage in 1999 and today Reeves announced plans to increase the National Living Wage by 6.7% to £12.21 an hour, worth up to £1,400 a year for a full-time worker.
‘For the first time, we will move towards a single adult rate phased in over time by initially increasing the National Minimum Wage for 18-20 year olds by 16.3%, as recommended by the Low Pay Commission, taking it to £10 an hour.’
Carers allowance weekly earnings limit increased
‘Carers are looking to increase the hours they work,’ said Reeves.
Carers allowance currently provides £81.90 a week to help those with additional caring responsibilities.
‘Today, I can confirm that we are increasing the weekly earnings limit to the equivalent of 16 hours at the National Living Wage per week, the largest increase in Carer’s Allowance since it was introduced in 1976.
‘That means a carer can now earn over £10,000 a year while receiving Carer’s Allowance, allowing them to increase their hours where they want to and keep more of their money.’
Universal debt repayments percentage lowered
Reeves announced £1 billion to extend the household support fund and discretionary housing payments to help those facing financial hardship.
She also pledged to reduce the level of debt repayments taken from universal credit from 25% to 15% of a standard allowance.
This means ‘1.2 million of the poorest households will keep more of their money each year, up to £420 a year.’
Workers’ rights
Reeves outlined plans to protect working people from unfair dismissal, safeguard them form bullying and provide better access to maternity and paternity leave.
Pensions triple lock kept
Pledging to keep the pensions triple lock, Reeves said spending on pensions will rise to £31 billion by 2029/30.
The new state pension will be uprated by 4.1% in 2025-26, meaning 12 million pensioners will gain up to £470 next year.
The Pension Credit Standard Minimum Guarantee will also rise by 4.1% from around £11,400 per year to around £11,850 for a single pensioner.
Fuel duty frozen
‘Increasing Fuel duty next year would be the wrong choice,’ said Reeves. ‘So I’ve decided to freeze fuel duty next year and save the 5p cut next year too. There will be no higher taxes at the petrol pumps next year.'
National insurance frozen for employees
‘I will not increase your national insurance, VAT or Income Tax,’ said Reeves.‘Working people will not see higher taxes in their payslips. A promise made and a promise fulfilled.
‘But to raise the revenues required to fund our public services & to restore public stability, I will increase employers' national insurance by 1.2% to 15% by April 2025.’
There will be no extension of the freeze in income tax and national insurance thresholds and instead personal tax thresholds will be uprated inline with inflation once again.
‘This government chooses to protect working people every single time,’ said Reeves.
Tobacco and soft drinks
The price of tobacco will rise inline with the Retail Price Index +2% and duty will be added on vapes from 2026.
A soft drinks industry levy will also be introduced, increasing duty inline with Consumer Price Index going forward.
These measures are designed to raise £1 billion a year.
Air passenger duty
Has not kept up with inflation in recent years, so Labour are introducing an adjustment, which will mean an increase of no more than £2 for a standard economy flight.
However, for those lucky enough to fly by private jet, the news is not so good. Air passenger duty will rise by 50%, costing around £450 per passenger for a private jet to California.
Alcohol duty
Duty rates on non-draught products are set to increase along with the Retail Price Index next year. However draught duty will be cut by 1.7%, cutting ‘a penny off the pint in the pub’.
Private schools and VAT
Currently 94% of the UK’s children attend state schools.
In a move designed to raise £9 billion for the treasury, ‘We will introduce VAT on private school fees from January 2025, and remove business rates relief too,’ said Reeves.
Breakfast clubs at schools
'Every child deserves to have very best start in life and the very best start to the school day too, so we’re tripling investment in breakfast clubs to fund them in thousands of schools,’ said Reeves.
The core schools budget will also be increased by £2.3 billion to hire thousands more teachers into key subjects.
A further £300m was pledged for further education, as SEN provision to improve outcomes for the most vulnerable children is to receive a £1 billion uplift in funding, up 6% from this year.
Schools in general will be given a 19% increase in funding through £6.7bn of capital investment to the Department for Education.
£1.4 billion has been earmarked for the schools in greatest need and a further £2.1 billion more for school maintenance.
NHS funding
The NHS will receive a £22.6 billion increase in its day to day health budget and a £3.1 billion increase in its capital budget. ‘The largest real terms growth outside of Covid since 2010,’ said Reeves.
The funding is designed to deliver repairs and upgrades to NHS buildings, increase capacity for tens of thousands of procedures and fund additional new beds.
Labour also plans to launch new surgical hubs and diagnostic centres, so people waiting for treatment can get it as quickly as possible.
‘We can now begin to bring waiting lists down,’ said Reeves. ‘Our target for waiting list times will be no longer than 18 weeks.’
‘These are the right choices to fix our NHS, protect working people and rebuild Britain.
‘More teachers in our schools, more appointments in our NHS and more homes being built.’
Key takeaways
- Minimum wage rises to £12.21 an hour as National Insurance is frozen for employees
- Pensions triple lock kept and fuel duty freeze continued
- Carers allowance weekly earnings limit increased and Universal debt repayments percentage lowered

Where can you get more space for your money?
Which homes offer the best value when it comes to price per square foot? Let’s take a look at the property types and locations that offer more bang for your buck.
Different ways of looking at property size
Buyers in the UK tend to focus on the number of bedrooms a property has when deciding what to buy.
But beyond the British Isles, the cost of floor space is the big deciding factor for home movers.
Looking at a home’s asking price per square foot (sq ft) is a logical way to assess its value for money, which is increasingly important in today’s affordability-challenged times.
Price per sq ft also deals with the challenge of homes and bedrooms coming in different shapes and sizes.
Some homes will have extra receptions, bathrooms and storage all adding to the total floor space, meaning the largest 3-bed semis can have 55% more space than the smallest ones.
Many buyers only find out about these differences during the viewings, whereas comparing homes on a price per sq ft basis can help you eliminate the ones that are simply too small and save you precious viewing time.
Average price per sq ft of different property types

While differences in the amount of floor space in homes can be subtle, the variations in price can be significant.
Looking at the cost per sq ft allows you to easily compare the value for money offered by each property type.
Which properties offer the best value in terms of space?
Our research finds that terraced homes offer the best value for money.
The price per sq ft of a terraced property ranges from £225 for a 2-bed to £235 for a 4-bed house.
Detached and semi-detached homes come with a higher price tag per sq ft but tend to offer more space and external features, such as off-street parking options.
Flats are often seen as offering the least value for money. However, that’s not always the case.
Outside of London, the average of a 2-bed flat is £245 per sq ft. That’s 9% lower than the average price of a 2-bed semi-detached house (£270 per sq ft).
Having said that, in the North West, Wales and London we find flats are some of the most expensive options when measured by cost per sq ft.
This is likely due to a rise in new developments featuring plenty of amenities in the cities of London, Manchester and Cardiff.

Most expensive areas per sq ft of property
In reality, what someone pays for a unit of space will vary by region as well as property type.
Outside of London, the average price per sq ft of property is £260. This means the space taken by a double-bed typically costs around £7,176 on average.
In London, that figure more than doubles to £585 per sq ft, meaning a double bed’s worth of space would cost £16,146.
However, buyers looking for a home in areas such as Erith (DA8), eastern Dagenham (RM10) and Belvedere (DA17) can pay less than £400/sq ft.
Those searching in neighbouring regions in southern England will pay £295 per sq ft, with prices rising to £295 in the South West and £375 in the South East.
Key takeaways
- The average UK home costs £300 per square foot
- A standard size double bed takes up 27.6 sq ft, costing buyers £8,280 on average
- Hartlepool is the cheapest area to buy when looking at pounds per square foot at £118 compared to Kensington and Chelsea at £1,373
- Homes in Inverclyde have seen the biggest percentage increase outside of London: up 13.2 per cent since 2023
- Terraced homes offer best value for money, ranging between £225 for a 2-bed and £235 for a 4-bed
- The average price per square foot ranges between £145 in the North East and £585 in London
- Historical seaside resorts and port towns offer the lowest prices, with Portsmouth, Plymouth, Dover, Great Yarmouth and Queensborough sitting at 38 to 45 per cent below their regional averages
Two fifths of workers unable to access home ownership in Great Britain
New report explores the affordability of housing to rent and buy across Great Britain.
In-depth analysis into the affordability of housing to rent and buy
Research team have published a new, comprehensive analysis into the affordability of housing to both rent and buy. This is important and timely as the ability of workers to access housing is shaping macro trends in the housing market with implications for home building, labour mobility and economic growth.
Access to housing and affordability is important for consumers making moving decisions. Moving home is often associated with positive themes such as trading-up to a larger home or moving to a better area.
However, the reality is that for a growing number of households it’s becoming more a question of what housing can be afforded and then considering compromises on location, size of home and accessibility to work.
The report highlights how single earner households and those on low incomes face much greater affordability challenges where the safety net of low cost rented homes is also inaccessible to cater for those in need.
The research report finds that the options to improve affordability are often limited due to the underlying structure of supply and limited choice of smaller sized homes to buy.
The analysis has important implications for the type and tenure of homes that need to be built as part of the 1.5m new homes target in England. The cross subsidy model of development is being challenged by weaker buying power of new home buyers. The report identifies three key focus areas for policy makers to start alleviating affordability challenges and improving access to housing.
A link to the full report is available at the end of this article.
Two fifths of working households are unable to buy
The headline finding is that 40% of full time workers in Great Britain are unable to afford to buy an average priced 2 or 3 bed home with an 80% loan to value mortgage.
Access to home ownership is most constrained in southern England and London where over half of workers can’t afford to buy an average priced 2 or 3 bed home.

The report finds that buying smaller homes and/or using a larger deposit are options to improve buying power and boost affordability but these may not be an option for many households.
Buying smaller homes delivers minimal gains highlighting the growing importance of equity as the key enabler of access to home ownership. Mortgage regulations introduced in 2015 stopped households taking on too much debt and creating a house price bubble but they have restricted access to housing, primarily across southern England.

Renting affordable to more workers than buying
While private rents have jumped by over 30% in the last 3 years, the ability of workers to access private rented housing is a better than for buying.
Just over a quarter of workers are unable to afford renting across Britain. However, in London the picture is much worse with two thirds unable to afford rental costs.
Better access to renting is, in part, down to the greater availability of smaller sized homes in the private rented sector. However, workers on the lowest 20% of earnings face major rental affordability challenges across Britain.
The lack of growth in the stock of social housing for 30 years, and the stalling of growth in private rented housing since 2016 has compounded the pressure on low income households which has driven demand for temporary accommodation.
Affordability becoming more of a problem across regional cities
While there is a clear north-south divide in affordability at the national level, housing affordability is becoming more challenging across regional cities outside southern England as growth in jobs and incomes pushes house prices and rents higher.
There are 18 local authority areas outside southern England where more than 40% of workers are unable to buy. The worst position is in York where 61% of workers are unable to buy. This is followed by areas including Trafford (57%) in Greater Manchester as well as Leicester (46%) and Edinburgh (45%).
The list is different for renting which is led by Manchester where 56% of workers are unable to afford to rent a 2/3 bed home. This is followed by Edinburgh (48%) and then a further 7 areas where more than 30% of workers are unable to afford rental costs led by Nottingham (38%), Salford (36%) and Glasgow (35%).

Three focus areas to start tackling affordability
The analysis shows Britain has a varied pattern of housing affordability with clear differences between buying and renting across the country. There is a link between tenures where pressures in one tenure can have impacts on another. This is most obvious in the rental market where the growing inaccessibility of home ownership increases the demand for renting.
There are no easy solutions for policy makers - the top 3 areas for focus identified in the report are as follows:
-
Build more smaller sized 1 and 2 bed homes for home purchase
-
Build more rented homes - social and private rented housing
-
Government to support creation of a market for long term fixed rate
Addressing housing affordability requires targeting supply into the market pinch-points of the market and taking a cross tenure view. Urgent attention is needed on the mortgage market and the extent to which lenders can support access to housing to a wider range of consumers.
While the narrative on building more homes is welcome, it’s important to shift the discussion on to the types and tenures of homes needed to support economic growth and boost access to housing for people on all incomes.
The home building model in the UK is changing and we will not deliver the homes the country needs without a clearer understanding and appreciation of who will buy them and what they can afford to pay. This applies to both consumer home owners and corporate investors buying homes for rent.
A reset in thinking is needed in policy circles on the new homes business model and the levers to support increased home building across Britain.
Key takeaways
- Affordability of housing increasingly shaping housing market trends with implications for home building, mortgage lending and economic growth
- New analysis finds 40% of full time workers are unable to buy an average priced 2 or 3 bed home in Great Britain
- Renting is more accessible than buying, with 27% of workers unable to afford rental costs despite fast growth in rents
- There is a wide north-south divide in affordability and access to housing is worst for single earners and those on low incomes
- Building more smaller homes to buy, boosting the supply of rented homes and launching a market for long term fixed rate loans are key focus areas for Government to start improving access to housing
- Without any policy response, market forces will shape affordability in the coming years mainly through very low nominal house price inflation and below average sales
Bank of England base rate held at 5%: what does this mean for mortgages?
What’s happened to the base rate?
The Bank of England has held the base rate, following last month's drop to 5% from 5.25%.
The base rate held at 5.25% for 11 months prior to last month's cut, having risen rapidly from a low of 0.1% in November 2021.
Higher base rates were needed to control inflation, which reached 10% in early 2023 and is currently hovering at 2.2%, just above the Government’s target of 2%.
The decision to hold the base rate, rather than increase it, will be welcome news for businesses and households alike, as it’s a sign that borrowing costs are not likely to increase.
As we look to next year, city economists are forecasting that it’s likely the base rate will fall to 4% by the end of 2025.
What does the base rate hold mean for mortgages?
The cost of a mortgage is not directly set by the Bank of England official base rate. Lenders mainly source their finance for fixed rate mortgages in the money markets.
The cost of this money is influenced by the expected direction of base rates, among other things.
Most borrowers using a mortgage to buy a property are on fixed rate loans for 2 or 5 years.
In the days leading up to the base rate announcement, two-year swap rates, that's the rates at which banks borrow money, started to drop from 4.3% to 4%.
Five-year swap rates dropped from 3.9% to 3.7%.
The situation has been improving for fixed mortgage rates too.
The latest Bank of England data for a five year fix 75% LTV has fallen to 4.3%, the lowest level seen in the last 2 years.
Based on current predictions, the mortgage rate forecast for 2025 is that rates will continue to go down, falling to around 4% by the end of next year.
Our Director of Research and Insight, Richard Donnell, says: “There is a mix of hope and expectation that average mortgage rates starting with a 3 will become the norm at some point soon, supporting those refinancing and breathing more life into the sales market by supporting home buyers.
“The underlying cost of finance for fixed rate loans has fallen in recent months as expectations for base rate cuts ebb and flow.
“This means average mortgage rates of 4-4.5% for a 5 year fix.”
But to help buyers, mortgage stress-testing needs to come down from around 8% to 6%.
“While the 'pay rate' for loans is falling, affordability stress tests continue in the background,” says Donnell. “This used to be 3% over the Standard Variable Rate and is now 1% over the revert rate once the initial deal comes to an end.
“This means lenders are typically stress testing new business at around 8%, although this appears an area where lenders are likely to be innovating to support new business and affordability.
“With city forecasts that the base rate will plateau at 3-3.25% by 2025/2026 it’s not unreasonable to assume the 5 year SWAP rate might plateau at this level.
“This will put average mortgage rates in the high 3% and low 4% range as the new normal.”
How will the base rate holding impact home buyers and the housing market?
The housing market is steadily adjusting to higher mortgage rates, with the worst of the impact felt in 2023.
2024 got off to a good start: households that put decisions on hold last year have returned to the market knowing that base rates aren’t going to rise any higher.
“The housing market is on track for 10% more homeowners moving compared to last year, and Zoopla expects average house prices to be 2% higher by the end of the year,” says Donnell.
"A key sign of confidence returning to the sales market is that buyers are paying almost 97% of the asking price. This is the highest it’s been for 18 months..
"Mortgage rates of 4-5%, while higher than the ultra low rates of 2019-2021, are becoming more manageable for home buyers. This is demonstrated by more sellers and more sales being agreed.
"Further growth in household incomes will help improve affordability, especially as we expect incomes to rise faster than house prices over the next 18 months."
What’s the impact on the mortgage market?
The mortgage market remains very competitive with lenders offering a wide range of mortgage deals for all types of buyer. Rates are changing all the time and responding to the outlook for the cost of borrowing.
If you’re looking to take out a new mortgage within the next six months, you can lock in the best rates available today.
When booking in a new mortgage deal, you can approach individual banks and building societies to find out their best rates. Or, you can work with a mortgage broker who will scour the market to find the best deals available to you.
Mojo Mortgages is part of the Zoopla family and works with over 70 different lenders across thousands of mortgage products.
Mojo won’t charge you for their services, because they charge the lender you choose to go with instead.
And if mortgage rates drop between now and the time your deal is due to start, you can ask your broker to rescan the mortgage market for you.
Key takeaways
- Bank of England base rate holds at 5%
- But swap rates, the rates banks pay to borrow money, have been falling in the last few days
- And the latest Bank of England data reveals 5-year, fixed-rate deals have fallen to 4.3%, the lowest level seen in the last 2 years

Should I buy my first home in 2024?
Mortgage rates have fallen by 1.2% since this time last year, saving the average first-time buyer £100-a-month in mortgage payments and £4,000 on a deposit.
A third of homes sold in the UK each year are bought by first-time buyers (FTBs).
But last year’s spike in mortgage rates meant buying a first-home became prohibitively expensive for many.
Highly motivated buyers either saved for bigger deposits or bought a smaller home than originally planned.
Others paused in their search, waiting for the cost of borrowing to fall.
Since the beginning of this year however, things have started to look up and our data shows demand for first homes has risen 20% year-on-year.
In fact, many first-time buyers are now looking at more expensive properties, averaging £249,100.

Mortgage repayments fall by £1,160 per year
According to Bank of England data, average mortgage rates have fallen from 5.7% last year to 4.5% today for those taking out a new 5-year, fixed-rate mortgage with a 25% deposit.
As a result, we estimate the average deposit is now £4,000 less than this time last year, despite many FTBs looking for larger homes and taking out larger mortgages.
Lower mortgage rates also mean lower monthly repayments, which have dropped from £1,076 to £979* for a typical first-time buyer home.
This translates to a monthly saving of £97 and an annual saving of £1,160.
However, as deposits fall and the prices of what FTBs are looking to buy increase, many are now borrowing more than they would have a year ago.
This, in turn, means that lenders will require a higher income to buy: £57,500 on average, up from £55,800 a year ago.
| Measure | July 24 | Jan 24 | July 23 |
|---|---|---|---|
| Most in-demand price point | £249,100 | £247,200 | £245,700 |
| Average deposit | £56,000 | £59,600 | £60,400 |
| Average mortgage size | £193,900 | £187,600 | £185,300 |
| Monthly repayment | £979 | £943 | £1,076 |
| Income to buy | £57,500 | £56,500 | £55,800 |
Zoopla research using UK Finance and Bank of England data
3-bed houses unquestionably the favourite choice
Half of first-time buyers outside of London are looking to buy a 3-bed house.
Despite mortgage rates rising in recent years, the more affordable end of the 3-bed market is still in reach for many households, especially for those looking to add value to their homes.
The exceptions are London and Scotland, where around a third of FTBs are looking to buy a 2-bed flat, making it the most popular choice in these regions.
This is largely down to the availability of stock in these areas, with flats being most commonly available, and the fact that affordability remains an important factor in the capital, given the high cost of buying a house there.

First-time buyers plan to spend £3,400 more on a home in 2024
Our data reveals FTBs are looking to buy homes costing £3,400 more than this time last year, an increase of 1.4%.
Yet mortgage rates have moderated over the same period, meaning monthy mortgage repayments have now dropped 9% for the average first-time buyer.
The prices of homes FTBs are looking to buy have risen the most in the North West (+4.4%) and East of England (+4.3%) since July 2023.
Prices for these homes were falling this time last year, but today’s reversal demonstrates that FTBs are now prepared to spend more on a home as the cost of borrowing comes down.
As well as being willing to pay higher prices, first-time buyers are also looking for larger homes in the North West and East of England, with three bedrooms or more.
However, in the North East and South of England, buyers are now looking for less expensive homes than in previous years.
This shows that mortgage rates haven’t fallen enough to ease affordability pressures in the South.
And while affordability looks stronger in the North East, first-time buyers are more sensitive to changes in the cost of living, which is why FTBs continue to look for lower-value homes here.
The prices of homes first-time buyers are looking to buy
| Location | July 24 | July 23 | Year-on-year change |
|---|---|---|---|
| South West | £244,400 | £250,900 | -2.6% |
| North East | £126,500 | £128,100 | -1.2% |
| South East | £327,700 | £331,400 | -1.1% |
| East Midlands | £213,800 | £213,700 | 0% |
| Scotland | £158,200 | £157,700 | +0.3% |
| Wales | £176,500 | £174,500 | +1.1% |
| Yorkshire & The Humber | £157,600 | £154,800 | +1.8% |
| London | £411,900 | £401,800 | +2.5% |
| West Midlands | £294,600 | £199,400 | +2.6% |
| East of England | £320,800 | £307,700 | +4.3% |
| North West | £171,500 | £164,200 | +4.4% |
| UK | £249,100 | £245,700 | +1.4% |
What’s the outlook for first-time buyer homes?
In 2024, the situation has improved for first-time buyers.
Growing earnings, modest house price growth and more attractive mortgage rates have boosted buying power for some, encouraging them to return to market.
However, affordability remains a key issue for many households interested in buying for the first time.
We expect mortgage rates to remain above 4% for the foreseeable future.
First-time buyers for whom this remains a barrier may choose to move further afield to access more affordable markets or consider purchasing a smaller property.
Looking to buy in 2024? Our Buying a Home guide has everything you need to know.
* Assumuming same mortgage term of 30 years; mortgage rates of 5.7% in 2023 and 4.5% in 2024; LTV of 75.4% in 2023 and 77.5% in 2024; and average price of £245,700 in 2023 and £249,100 in 2024.
Key takeaways
- Mortgage rates fall from 5.7% to 4.5% in a year, cutting £4,000 off the average deposit needed to buy a first home
- Monthly mortgage repayments are also less hefty, down £97-a-month compared to July 2023
- First-time buyers are now looking to spend £3,400 more on their first home as a result
Rents start falling in major cities
Our exclusive research for the BBC reveals rents are starting to fall in parts of the UK, as the pace of rental inflation hits its lowest level in nearly 3 years.
We’re past peak rental inflation
The recent boom in rent rises for new lets is coming to an end.
Rents have been rising faster than earnings for the past 3 years but they are now increasing at their slowest pace since 2021.
In news that will be welcomed by under-pressure renters looking to move, this is a clear sign that we’ve passed peak rental inflation.
Demand for rented homes has fallen by 39% over the last year, albeit off a high base, and the rental market has moved from ‘red-hot’ to still ‘hot’.
Our data shows there are 17 people still chasing every home for rent, which is double the pre-pandemic average seen between 2017-2019.
But the supply of rental homes available per estate agent has slowly started rising, increasing by 17% in the last year.
This is because more homes are being bought by corporate landlords, while lower mortgage rates are making it a little easier for renters to buy their first home, freeing up rental properties.
However, the general availability of homes for rent remains a major challenge for renters: the average agent still has a third fewer rental homes available than the pre pandemic average.
Rents rise at slowest pace in nearly 3 years

Rents for new lets have risen by 5.7% over the last 12 months, reaching an average £1,232 per month across the UK.
But in the last 6 months, they’ve risen by just 1.6%, the lowest increase seen since 2021.
The heat is coming out of the rental market, mainly as a result of affordability pressures.
If rises remain on this trajectory, rents for new lets are on track to be 3-4% higher over 2024, versus 8% in 2023 and 11% in 2022.
75% of cities record lower rent inflation

Changes in supply and demand at a city and local level are impacting rents to different degrees.
A slowdown in overseas student applications and a weaker labour market both explain some of this weakening in demand for renting.
Falling mortgage rates are also helping some renters to become first time buyers, freeing up rental homes for others.
In some cities, rents have been rising so fast they have ‘over-shot’ what renters are prepared to pay. As a result, we’re now seeing rents falling in some areas.
Our rental index tracks rents across 64 cities. In the first 6 months of 2024, rents have fallen in 5 cities: Nottingham, London, Worthing, Brighton and Glasgow. Meanwhile, the rate of inflation has dropped significantly across 75% of cities.
However, rents are still rising fast in some, for example Bradford and Liverpool, where there is headroom for rents to rise at an increased rate.
Overall, rents are rising fastest in accessible suburbs, larger cities and areas where rental properties are still offering some value for money.
Rochdale, Doncaster, Sunderland, Southend and Telford have all recorded rental inflation of over 4% in H1 2024.
Rents fall across a third of London boroughs

London is the UK’s most expensive market to be a renter.
With an average monthly rent of £2,172, almost 70% higher than the UK average, rents here are more than twice the price of many other regions.
The high cost of renting in the capital means affordability is a growing constraint on rental inflation and our index shows rents have fallen in more than a third of London boroughs in the first half of 2024.
The falls have been concentrated in inner east London, led by Tower Hamlets, Newham and Greenwich. And rental inflation has now slowed across all areas of the capital.
Corporate investors are buying new homes for rent, boosting supply and increasing choice, which also explains why rents have been rising more slowly across London, alongside affordability constraints.
However, higher growth rates are still being registered in outer London areas, led by Merton and Havering, where rents are below the London-wide average.
Key takeaways
- Rents start falling in London, Brighton, Glasgow, Nottingham and Worthing
- A third of London’s boroughs see rents come down
- Across the UK, rents are expected to rise by just 3-4% in 2024, a big drop from the increases seen in 2022 (11%) and 2023 (8%)

Will mortgage rates go down in 2024?
Mortgage rates are not expected to fall further this year, but rising wages are likely to improve affordability for buyers as house prices stay flat.
Buyers are currently watching the Bank of England’s latest Base Rate announcements like never before.
But despite the latest much anticipated drop from 5.25% to 5%, mortgage rates are expected to remain at around 4-4.5% for the rest of the year.
That said, mortgage rates have come down since June last year, when the average five-year fixed-rate loan for a 75% loan-to-value mortgage peaked at 5.8%, adding hundreds of pounds to monthly mortgage repayments for buyers and homeowners.
Today, that same mortgage has now fallen to an average rate of 4.4%.
Here’s how that difference pans out in terms of monthly mortgage payments.
Monthly repayments on a five-year fixed-rate 75% LTV over 25 years
|
Mortgage value |
£200,000 property value, 25% deposit |
£300,000 property value, 25% deposit |
£400,000 property value, 25% deposit |
£500,000 property value, 25% deposit |
|
5.8% monthly repayments |
£1,106 |
£1,422 |
£1,896 |
£2,370 |
|
4.4% monthly repayments |
£962 |
£1,237 |
£1,650 |
£2,063 |
Mortgage rates unlikely to drop below 4% in 2024
Buyers holding out for lower mortgage rates in 2024 may be disappointed, as they are unlikely to decline much further this year, even if inflation and the Base Rate edge lower.
Our Executive Director of Research, Richard Donnell, says: ‘Expectations of lower interest rates are already priced into fixed rate mortgages today.
‘Lower interest rates would likely result in further modest declines in mortgage rates but how far depends on how low money markets see base rates falling.
‘Economists currently expect base rates to fall to 3.5% by the end of 2025, which would imply mortgage rates remaining in and around the 4%+ range.’
Why are mortgage rates going down?
Mortgage rates began to go down in the latter half of 2023, as inflation dropped from 6.3% in September to 4.2% in December.
In June this year, inflation hit its 2% target, but it has risen slightly since then and is currently sitting at 2.2%.
However, the Bank of England held the base rate at 5.25% 7 times in a row, until it met in August this year, when it lowered it to 5%.
By the end of 2025, it's expected to lower it to 3.5%.
The bank rate determines the interest rate the Bank of England pays to commercial banks that hold money with them. It influences the rates those banks charge people to borrow money or pay on their savings.
What factors affect interest rates?
Inflation is the main reason interest rates have been high in the UK over the last 30 months. An unexpected rise in demand - or decrease in supply - can cause inflation to rise.
At the end of 2021, the Bank of England began to raise the base rate in order to reduce inflation and help slow down price rises for everyday items including food, petrol, gas and electricity.
It has worked - and inflation is currently hovering around its 2% target, but the Bank of England needs to keep the base rate high enough to ensure inflation doesn't rise again.
Global shocks can also have an impact on inflation, such as wars, pandemics or the blockage of major transport routes like the Suez Canal, as they affect the flow of goods around the globe.
How buyer affordability could improve in 2024
All that said, there are other ways in which buyer affordability is likely to improve this year: and that’s wages rising while house prices hold steady.
This trend is happening already, and it’s improving confidence among buyers.
‘Rising household disposable incomes are expected to be the primary driver of improved housing affordability over 2024,’ says Donnell.
‘Disposable incomes are projected to increase by 3.5% over 2024, while house prices look set to remain broadly flat over the year.’
In fact, momentum in the housing market is already ticking up and the number of sales agreed has climbed 9% year-on-year.
This, in turn, is encouraging more sellers to come to market, improving the choice available for buyers.
More choice for buyers in 2024
There are now more homes for sale than at any point in the last six years. This is improving choice for home buyers and supporting more sales.
The average estate agent has 33 homes for sale, which is 16% higher than a year ago.
More supply means more sellers, most of whom are also buyers.
And more choice for buyers means more opportunity for wriggle room when it comes to paying the asking price.
‘Our view is that a greater availability of homes for sale will keep price rises in check,’ says Donnell.
‘This means buyers have more choice and room to negotiate, especially where homes are failing to attract buyer interest in a timely manner.’
Affordable areas remain popular with buyers
While momentum is up among buyers and sellers across the UK, in more challenging mortgage rate times, it’s the affordable areas that are proving to be the biggest draw for buyers.
‘Sales activity is up across the board, with the strongest growth in sales taking place in areas with more affordable house prices, such as Yorkshire and the Humber (11%) and the North West (13%),’ says Donnell.
Meanwhile, the strongest growth in new sellers listing homes can be seen in the South West (28%) and North East (26%).
Over in the capital, the supply of homes for sale is just 8% higher, which means house prices are rebounding faster here than other parts of the UK, as more buyers compete for properties.
Asking price discounts narrow as house prices hold steady
While it remains a buyers’ market right now, buyers should know that the discounts being offered by sellers are starting to get smaller.
UK buyers are currently paying 96.8% of the asking price, which is up from 95.6% last October.
In value terms, this averages at £16,600 below the asking price for sales agreed in June 2024, compared to £23,000 below the asking price in October 2023.
There continues to be a north/south divide in house prices, with homes in the south continuing to register house price falls as homes in the north see house price growth.
But all areas are recording higher annual price inflation than six months ago, as sales volumes recover and pricing levels firm.
So while there’s still room to negotiate, house prices are starting to hold steady in 2024 and we don’t expect to see a further fall in property prices this year.
Key takeaways
- Mortgage rates expected to stay in and around 4+% for the rest of 2024
- House prices will hold steady as rising wages improve affordability
- There are now more homes for sale than at any point in the last six years
- The Base Rate is expected to fall to 3.5% at the end of 2025