
Where can you get more space for your money?
Which homes offer the best value when it comes to price per square foot? Let’s take a look at the property types and locations that offer more bang for your buck.
Different ways of looking at property size
Buyers in the UK tend to focus on the number of bedrooms a property has when deciding what to buy.
But beyond the British Isles, the cost of floor space is the big deciding factor for home movers.
Looking at a home’s asking price per square foot (sq ft) is a logical way to assess its value for money, which is increasingly important in today’s affordability-challenged times.
Price per sq ft also deals with the challenge of homes and bedrooms coming in different shapes and sizes.
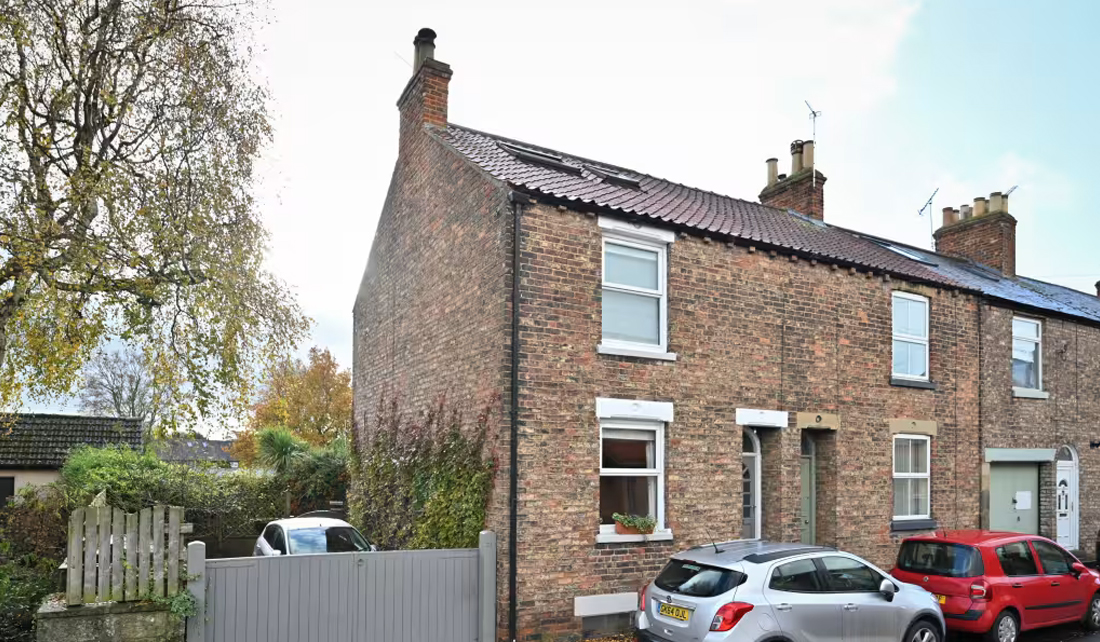
Some homes will have extra receptions, bathrooms and storage all adding to the total floor space, meaning the largest 3-bed semis can have 55% more space than the smallest ones.
Many buyers only find out about these differences during the viewings, whereas comparing homes on a price per sq ft basis can help you eliminate the ones that are simply too small and save you precious viewing time.
Average price per sq ft of different property types

While differences in the amount of floor space in homes can be subtle, the variations in price can be significant.
Looking at the cost per sq ft allows you to easily compare the value for money offered by each property type.
Which properties offer the best value in terms of space?
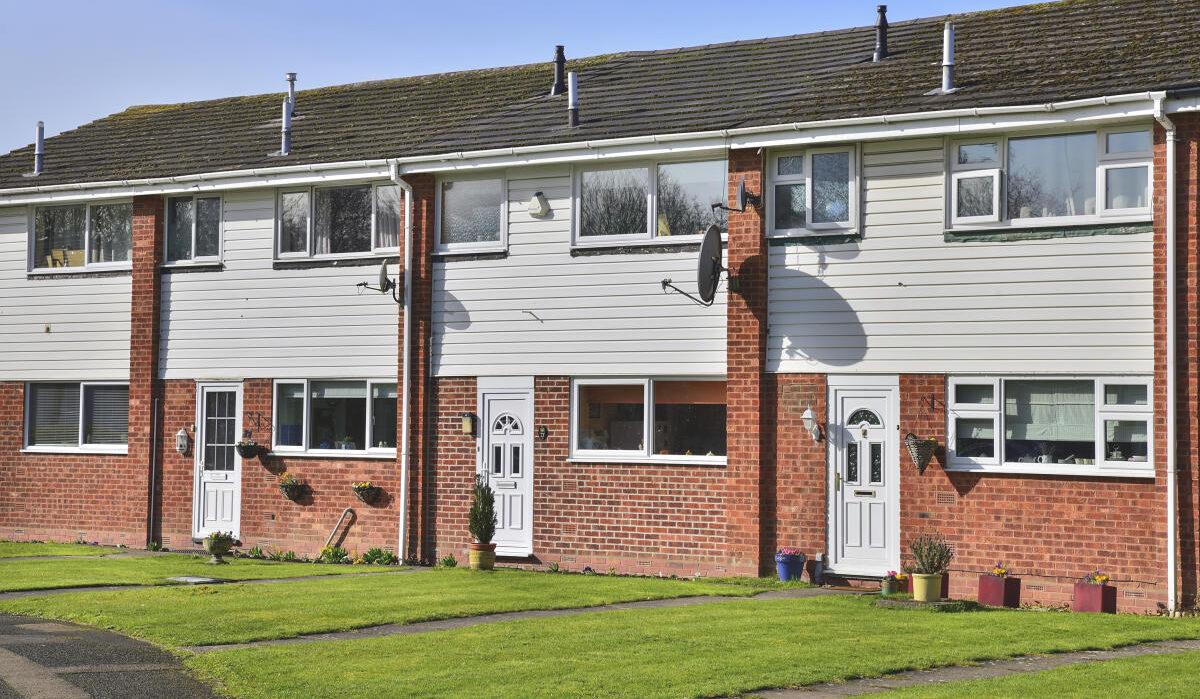
Our research finds that terraced homes offer the best value for money.
The price per sq ft of a terraced property ranges from £225 for a 2-bed to £235 for a 4-bed house.
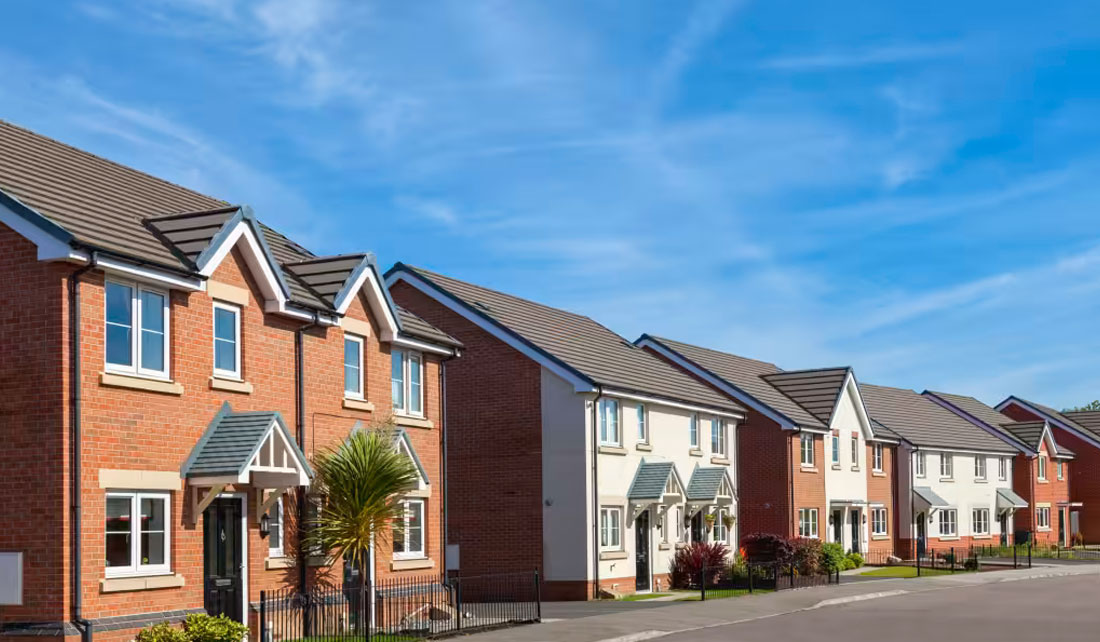
Detached and semi-detached homes come with a higher price tag per sq ft but tend to offer more space and external features, such as off-street parking options.
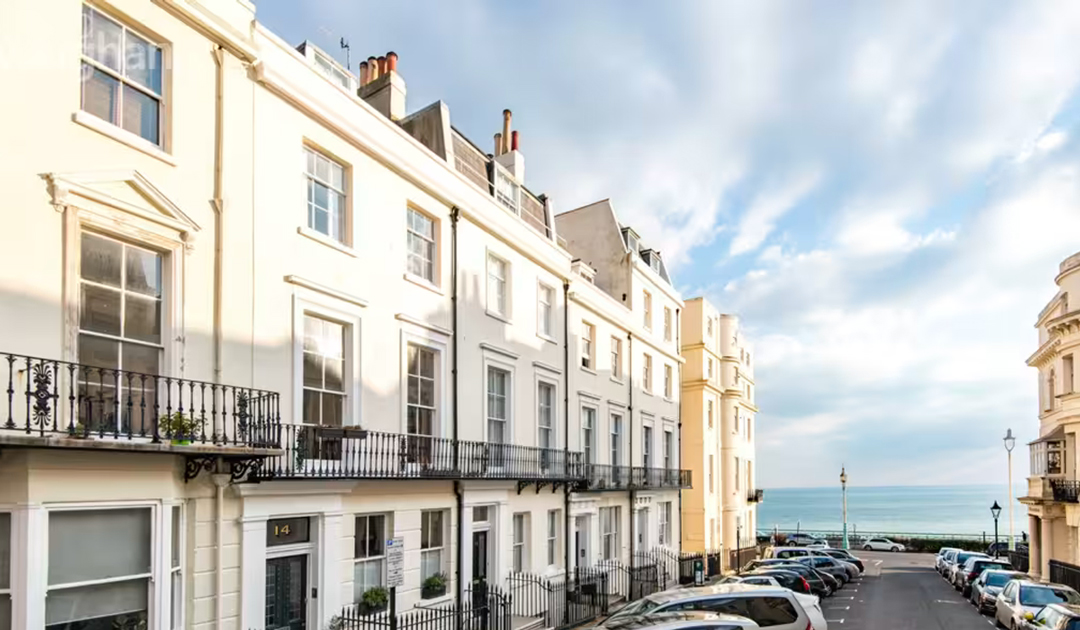
Flats are often seen as offering the least value for money. However, that’s not always the case.
Outside of London, the average of a 2-bed flat is £245 per sq ft. That’s 9% lower than the average price of a 2-bed semi-detached house (£270 per sq ft).
Having said that, in the North West, Wales and London we find flats are some of the most expensive options when measured by cost per sq ft.
This is likely due to a rise in new developments featuring plenty of amenities in the cities of London, Manchester and Cardiff.

Most expensive areas per sq ft of property
In reality, what someone pays for a unit of space will vary by region as well as property type.
Outside of London, the average price per sq ft of property is £260. This means the space taken by a double-bed typically costs around £7,176 on average.
In London, that figure more than doubles to £585 per sq ft, meaning a double bed’s worth of space would cost £16,146.
However, buyers looking for a home in areas such as Erith (DA8), eastern Dagenham (RM10) and Belvedere (DA17) can pay less than £400/sq ft.
Those searching in neighbouring regions in southern England will pay £295 per sq ft, with prices rising to £295 in the South West and £375 in the South East.
Key takeaways
- The average UK home costs £300 per square foot
- A standard size double bed takes up 27.6 sq ft, costing buyers £8,280 on average
- Hartlepool is the cheapest area to buy when looking at pounds per square foot at £118 compared to Kensington and Chelsea at £1,373
- Homes in Inverclyde have seen the biggest percentage increase outside of London: up 13.2 per cent since 2023
- Terraced homes offer best value for money, ranging between £225 for a 2-bed and £235 for a 4-bed
- The average price per square foot ranges between £145 in the North East and £585 in London
- Historical seaside resorts and port towns offer the lowest prices, with Portsmouth, Plymouth, Dover, Great Yarmouth and Queensborough sitting at 38 to 45 per cent below their regional averages
Two fifths of workers unable to access home ownership in Great Britain
New report explores the affordability of housing to rent and buy across Great Britain.
In-depth analysis into the affordability of housing to rent and buy
Research team have published a new, comprehensive analysis into the affordability of housing to both rent and buy. This is important and timely as the ability of workers to access housing is shaping macro trends in the housing market with implications for home building, labour mobility and economic growth.
Access to housing and affordability is important for consumers making moving decisions. Moving home is often associated with positive themes such as trading-up to a larger home or moving to a better area.
However, the reality is that for a growing number of households it’s becoming more a question of what housing can be afforded and then considering compromises on location, size of home and accessibility to work.
The report highlights how single earner households and those on low incomes face much greater affordability challenges where the safety net of low cost rented homes is also inaccessible to cater for those in need.
The research report finds that the options to improve affordability are often limited due to the underlying structure of supply and limited choice of smaller sized homes to buy.
The analysis has important implications for the type and tenure of homes that need to be built as part of the 1.5m new homes target in England. The cross subsidy model of development is being challenged by weaker buying power of new home buyers. The report identifies three key focus areas for policy makers to start alleviating affordability challenges and improving access to housing.
A link to the full report is available at the end of this article.
Two fifths of working households are unable to buy
The headline finding is that 40% of full time workers in Great Britain are unable to afford to buy an average priced 2 or 3 bed home with an 80% loan to value mortgage.
Access to home ownership is most constrained in southern England and London where over half of workers can’t afford to buy an average priced 2 or 3 bed home.

The report finds that buying smaller homes and/or using a larger deposit are options to improve buying power and boost affordability but these may not be an option for many households.
Buying smaller homes delivers minimal gains highlighting the growing importance of equity as the key enabler of access to home ownership. Mortgage regulations introduced in 2015 stopped households taking on too much debt and creating a house price bubble but they have restricted access to housing, primarily across southern England.

Renting affordable to more workers than buying
While private rents have jumped by over 30% in the last 3 years, the ability of workers to access private rented housing is a better than for buying.
Just over a quarter of workers are unable to afford renting across Britain. However, in London the picture is much worse with two thirds unable to afford rental costs.
Better access to renting is, in part, down to the greater availability of smaller sized homes in the private rented sector. However, workers on the lowest 20% of earnings face major rental affordability challenges across Britain.
The lack of growth in the stock of social housing for 30 years, and the stalling of growth in private rented housing since 2016 has compounded the pressure on low income households which has driven demand for temporary accommodation.
Affordability becoming more of a problem across regional cities
While there is a clear north-south divide in affordability at the national level, housing affordability is becoming more challenging across regional cities outside southern England as growth in jobs and incomes pushes house prices and rents higher.
There are 18 local authority areas outside southern England where more than 40% of workers are unable to buy. The worst position is in York where 61% of workers are unable to buy. This is followed by areas including Trafford (57%) in Greater Manchester as well as Leicester (46%) and Edinburgh (45%).
The list is different for renting which is led by Manchester where 56% of workers are unable to afford to rent a 2/3 bed home. This is followed by Edinburgh (48%) and then a further 7 areas where more than 30% of workers are unable to afford rental costs led by Nottingham (38%), Salford (36%) and Glasgow (35%).

Three focus areas to start tackling affordability
The analysis shows Britain has a varied pattern of housing affordability with clear differences between buying and renting across the country. There is a link between tenures where pressures in one tenure can have impacts on another. This is most obvious in the rental market where the growing inaccessibility of home ownership increases the demand for renting.
There are no easy solutions for policy makers - the top 3 areas for focus identified in the report are as follows:
-
Build more smaller sized 1 and 2 bed homes for home purchase
-
Build more rented homes - social and private rented housing
-
Government to support creation of a market for long term fixed rate
Addressing housing affordability requires targeting supply into the market pinch-points of the market and taking a cross tenure view. Urgent attention is needed on the mortgage market and the extent to which lenders can support access to housing to a wider range of consumers.
While the narrative on building more homes is welcome, it’s important to shift the discussion on to the types and tenures of homes needed to support economic growth and boost access to housing for people on all incomes.
The home building model in the UK is changing and we will not deliver the homes the country needs without a clearer understanding and appreciation of who will buy them and what they can afford to pay. This applies to both consumer home owners and corporate investors buying homes for rent.
A reset in thinking is needed in policy circles on the new homes business model and the levers to support increased home building across Britain.
Key takeaways
- Affordability of housing increasingly shaping housing market trends with implications for home building, mortgage lending and economic growth
- New analysis finds 40% of full time workers are unable to buy an average priced 2 or 3 bed home in Great Britain
- Renting is more accessible than buying, with 27% of workers unable to afford rental costs despite fast growth in rents
- There is a wide north-south divide in affordability and access to housing is worst for single earners and those on low incomes
- Building more smaller homes to buy, boosting the supply of rented homes and launching a market for long term fixed rate loans are key focus areas for Government to start improving access to housing
- Without any policy response, market forces will shape affordability in the coming years mainly through very low nominal house price inflation and below average sales
Bank of England base rate held at 5%: what does this mean for mortgages?
What’s happened to the base rate?
The Bank of England has held the base rate, following last month's drop to 5% from 5.25%.
The base rate held at 5.25% for 11 months prior to last month's cut, having risen rapidly from a low of 0.1% in November 2021.
Higher base rates were needed to control inflation, which reached 10% in early 2023 and is currently hovering at 2.2%, just above the Government’s target of 2%.
The decision to hold the base rate, rather than increase it, will be welcome news for businesses and households alike, as it’s a sign that borrowing costs are not likely to increase.
As we look to next year, city economists are forecasting that it’s likely the base rate will fall to 4% by the end of 2025.
What does the base rate hold mean for mortgages?
The cost of a mortgage is not directly set by the Bank of England official base rate. Lenders mainly source their finance for fixed rate mortgages in the money markets.
The cost of this money is influenced by the expected direction of base rates, among other things.
Most borrowers using a mortgage to buy a property are on fixed rate loans for 2 or 5 years.
In the days leading up to the base rate announcement, two-year swap rates, that's the rates at which banks borrow money, started to drop from 4.3% to 4%.
Five-year swap rates dropped from 3.9% to 3.7%.
The situation has been improving for fixed mortgage rates too.
The latest Bank of England data for a five year fix 75% LTV has fallen to 4.3%, the lowest level seen in the last 2 years.
Based on current predictions, the mortgage rate forecast for 2025 is that rates will continue to go down, falling to around 4% by the end of next year.
Our Director of Research and Insight, Richard Donnell, says: “There is a mix of hope and expectation that average mortgage rates starting with a 3 will become the norm at some point soon, supporting those refinancing and breathing more life into the sales market by supporting home buyers.
“The underlying cost of finance for fixed rate loans has fallen in recent months as expectations for base rate cuts ebb and flow.
“This means average mortgage rates of 4-4.5% for a 5 year fix.”
But to help buyers, mortgage stress-testing needs to come down from around 8% to 6%.
“While the 'pay rate' for loans is falling, affordability stress tests continue in the background,” says Donnell. “This used to be 3% over the Standard Variable Rate and is now 1% over the revert rate once the initial deal comes to an end.
“This means lenders are typically stress testing new business at around 8%, although this appears an area where lenders are likely to be innovating to support new business and affordability.
“With city forecasts that the base rate will plateau at 3-3.25% by 2025/2026 it’s not unreasonable to assume the 5 year SWAP rate might plateau at this level.
“This will put average mortgage rates in the high 3% and low 4% range as the new normal.”
How will the base rate holding impact home buyers and the housing market?
The housing market is steadily adjusting to higher mortgage rates, with the worst of the impact felt in 2023.
2024 got off to a good start: households that put decisions on hold last year have returned to the market knowing that base rates aren’t going to rise any higher.
“The housing market is on track for 10% more homeowners moving compared to last year, and Zoopla expects average house prices to be 2% higher by the end of the year,” says Donnell.
"A key sign of confidence returning to the sales market is that buyers are paying almost 97% of the asking price. This is the highest it’s been for 18 months..
"Mortgage rates of 4-5%, while higher than the ultra low rates of 2019-2021, are becoming more manageable for home buyers. This is demonstrated by more sellers and more sales being agreed.
"Further growth in household incomes will help improve affordability, especially as we expect incomes to rise faster than house prices over the next 18 months."
What’s the impact on the mortgage market?
The mortgage market remains very competitive with lenders offering a wide range of mortgage deals for all types of buyer. Rates are changing all the time and responding to the outlook for the cost of borrowing.
If you’re looking to take out a new mortgage within the next six months, you can lock in the best rates available today.
When booking in a new mortgage deal, you can approach individual banks and building societies to find out their best rates. Or, you can work with a mortgage broker who will scour the market to find the best deals available to you.
Mojo Mortgages is part of the Zoopla family and works with over 70 different lenders across thousands of mortgage products.
Mojo won’t charge you for their services, because they charge the lender you choose to go with instead.
And if mortgage rates drop between now and the time your deal is due to start, you can ask your broker to rescan the mortgage market for you.
Key takeaways
- Bank of England base rate holds at 5%
- But swap rates, the rates banks pay to borrow money, have been falling in the last few days
- And the latest Bank of England data reveals 5-year, fixed-rate deals have fallen to 4.3%, the lowest level seen in the last 2 years

Should I buy my first home in 2024?
Mortgage rates have fallen by 1.2% since this time last year, saving the average first-time buyer £100-a-month in mortgage payments and £4,000 on a deposit.
A third of homes sold in the UK each year are bought by first-time buyers (FTBs).
But last year’s spike in mortgage rates meant buying a first-home became prohibitively expensive for many.
Highly motivated buyers either saved for bigger deposits or bought a smaller home than originally planned.
Others paused in their search, waiting for the cost of borrowing to fall.
Since the beginning of this year however, things have started to look up and our data shows demand for first homes has risen 20% year-on-year.
In fact, many first-time buyers are now looking at more expensive properties, averaging £249,100.

Mortgage repayments fall by £1,160 per year
According to Bank of England data, average mortgage rates have fallen from 5.7% last year to 4.5% today for those taking out a new 5-year, fixed-rate mortgage with a 25% deposit.
As a result, we estimate the average deposit is now £4,000 less than this time last year, despite many FTBs looking for larger homes and taking out larger mortgages.
Lower mortgage rates also mean lower monthly repayments, which have dropped from £1,076 to £979* for a typical first-time buyer home.
This translates to a monthly saving of £97 and an annual saving of £1,160.
However, as deposits fall and the prices of what FTBs are looking to buy increase, many are now borrowing more than they would have a year ago.
This, in turn, means that lenders will require a higher income to buy: £57,500 on average, up from £55,800 a year ago.
| Measure | July 24 | Jan 24 | July 23 |
|---|---|---|---|
| Most in-demand price point | £249,100 | £247,200 | £245,700 |
| Average deposit | £56,000 | £59,600 | £60,400 |
| Average mortgage size | £193,900 | £187,600 | £185,300 |
| Monthly repayment | £979 | £943 | £1,076 |
| Income to buy | £57,500 | £56,500 | £55,800 |
Zoopla research using UK Finance and Bank of England data
3-bed houses unquestionably the favourite choice
Half of first-time buyers outside of London are looking to buy a 3-bed house.
Despite mortgage rates rising in recent years, the more affordable end of the 3-bed market is still in reach for many households, especially for those looking to add value to their homes.
The exceptions are London and Scotland, where around a third of FTBs are looking to buy a 2-bed flat, making it the most popular choice in these regions.
This is largely down to the availability of stock in these areas, with flats being most commonly available, and the fact that affordability remains an important factor in the capital, given the high cost of buying a house there.

First-time buyers plan to spend £3,400 more on a home in 2024
Our data reveals FTBs are looking to buy homes costing £3,400 more than this time last year, an increase of 1.4%.
Yet mortgage rates have moderated over the same period, meaning monthy mortgage repayments have now dropped 9% for the average first-time buyer.
The prices of homes FTBs are looking to buy have risen the most in the North West (+4.4%) and East of England (+4.3%) since July 2023.
Prices for these homes were falling this time last year, but today’s reversal demonstrates that FTBs are now prepared to spend more on a home as the cost of borrowing comes down.
As well as being willing to pay higher prices, first-time buyers are also looking for larger homes in the North West and East of England, with three bedrooms or more.
However, in the North East and South of England, buyers are now looking for less expensive homes than in previous years.
This shows that mortgage rates haven’t fallen enough to ease affordability pressures in the South.
And while affordability looks stronger in the North East, first-time buyers are more sensitive to changes in the cost of living, which is why FTBs continue to look for lower-value homes here.
The prices of homes first-time buyers are looking to buy
| Location | July 24 | July 23 | Year-on-year change |
|---|---|---|---|
| South West | £244,400 | £250,900 | -2.6% |
| North East | £126,500 | £128,100 | -1.2% |
| South East | £327,700 | £331,400 | -1.1% |
| East Midlands | £213,800 | £213,700 | 0% |
| Scotland | £158,200 | £157,700 | +0.3% |
| Wales | £176,500 | £174,500 | +1.1% |
| Yorkshire & The Humber | £157,600 | £154,800 | +1.8% |
| London | £411,900 | £401,800 | +2.5% |
| West Midlands | £294,600 | £199,400 | +2.6% |
| East of England | £320,800 | £307,700 | +4.3% |
| North West | £171,500 | £164,200 | +4.4% |
| UK | £249,100 | £245,700 | +1.4% |
What’s the outlook for first-time buyer homes?
In 2024, the situation has improved for first-time buyers.
Growing earnings, modest house price growth and more attractive mortgage rates have boosted buying power for some, encouraging them to return to market.
However, affordability remains a key issue for many households interested in buying for the first time.
We expect mortgage rates to remain above 4% for the foreseeable future.
First-time buyers for whom this remains a barrier may choose to move further afield to access more affordable markets or consider purchasing a smaller property.
Looking to buy in 2024? Our Buying a Home guide has everything you need to know.
* Assumuming same mortgage term of 30 years; mortgage rates of 5.7% in 2023 and 4.5% in 2024; LTV of 75.4% in 2023 and 77.5% in 2024; and average price of £245,700 in 2023 and £249,100 in 2024.
Key takeaways
- Mortgage rates fall from 5.7% to 4.5% in a year, cutting £4,000 off the average deposit needed to buy a first home
- Monthly mortgage repayments are also less hefty, down £97-a-month compared to July 2023
- First-time buyers are now looking to spend £3,400 more on their first home as a result
Rents start falling in major cities
Our exclusive research for the BBC reveals rents are starting to fall in parts of the UK, as the pace of rental inflation hits its lowest level in nearly 3 years.
We’re past peak rental inflation
The recent boom in rent rises for new lets is coming to an end.
Rents have been rising faster than earnings for the past 3 years but they are now increasing at their slowest pace since 2021.
In news that will be welcomed by under-pressure renters looking to move, this is a clear sign that we’ve passed peak rental inflation.
Demand for rented homes has fallen by 39% over the last year, albeit off a high base, and the rental market has moved from ‘red-hot’ to still ‘hot’.
Our data shows there are 17 people still chasing every home for rent, which is double the pre-pandemic average seen between 2017-2019.
But the supply of rental homes available per estate agent has slowly started rising, increasing by 17% in the last year.
This is because more homes are being bought by corporate landlords, while lower mortgage rates are making it a little easier for renters to buy their first home, freeing up rental properties.
However, the general availability of homes for rent remains a major challenge for renters: the average agent still has a third fewer rental homes available than the pre pandemic average.
Rents rise at slowest pace in nearly 3 years

Rents for new lets have risen by 5.7% over the last 12 months, reaching an average £1,232 per month across the UK.
But in the last 6 months, they’ve risen by just 1.6%, the lowest increase seen since 2021.
The heat is coming out of the rental market, mainly as a result of affordability pressures.
If rises remain on this trajectory, rents for new lets are on track to be 3-4% higher over 2024, versus 8% in 2023 and 11% in 2022.
75% of cities record lower rent inflation

Changes in supply and demand at a city and local level are impacting rents to different degrees.
A slowdown in overseas student applications and a weaker labour market both explain some of this weakening in demand for renting.
Falling mortgage rates are also helping some renters to become first time buyers, freeing up rental homes for others.
In some cities, rents have been rising so fast they have ‘over-shot’ what renters are prepared to pay. As a result, we’re now seeing rents falling in some areas.
Our rental index tracks rents across 64 cities. In the first 6 months of 2024, rents have fallen in 5 cities: Nottingham, London, Worthing, Brighton and Glasgow. Meanwhile, the rate of inflation has dropped significantly across 75% of cities.
However, rents are still rising fast in some, for example Bradford and Liverpool, where there is headroom for rents to rise at an increased rate.
Overall, rents are rising fastest in accessible suburbs, larger cities and areas where rental properties are still offering some value for money.
Rochdale, Doncaster, Sunderland, Southend and Telford have all recorded rental inflation of over 4% in H1 2024.
Rents fall across a third of London boroughs

London is the UK’s most expensive market to be a renter.
With an average monthly rent of £2,172, almost 70% higher than the UK average, rents here are more than twice the price of many other regions.
The high cost of renting in the capital means affordability is a growing constraint on rental inflation and our index shows rents have fallen in more than a third of London boroughs in the first half of 2024.
The falls have been concentrated in inner east London, led by Tower Hamlets, Newham and Greenwich. And rental inflation has now slowed across all areas of the capital.
Corporate investors are buying new homes for rent, boosting supply and increasing choice, which also explains why rents have been rising more slowly across London, alongside affordability constraints.
However, higher growth rates are still being registered in outer London areas, led by Merton and Havering, where rents are below the London-wide average.
Key takeaways
- Rents start falling in London, Brighton, Glasgow, Nottingham and Worthing
- A third of London’s boroughs see rents come down
- Across the UK, rents are expected to rise by just 3-4% in 2024, a big drop from the increases seen in 2022 (11%) and 2023 (8%)

Will mortgage rates go down in 2024?
Mortgage rates are not expected to fall further this year, but rising wages are likely to improve affordability for buyers as house prices stay flat.
Buyers are currently watching the Bank of England’s latest Base Rate announcements like never before.
But despite the latest much anticipated drop from 5.25% to 5%, mortgage rates are expected to remain at around 4-4.5% for the rest of the year.
That said, mortgage rates have come down since June last year, when the average five-year fixed-rate loan for a 75% loan-to-value mortgage peaked at 5.8%, adding hundreds of pounds to monthly mortgage repayments for buyers and homeowners.
Today, that same mortgage has now fallen to an average rate of 4.4%.
Here’s how that difference pans out in terms of monthly mortgage payments.
Monthly repayments on a five-year fixed-rate 75% LTV over 25 years
|
Mortgage value |
£200,000 property value, 25% deposit |
£300,000 property value, 25% deposit |
£400,000 property value, 25% deposit |
£500,000 property value, 25% deposit |
|
5.8% monthly repayments |
£1,106 |
£1,422 |
£1,896 |
£2,370 |
|
4.4% monthly repayments |
£962 |
£1,237 |
£1,650 |
£2,063 |
Mortgage rates unlikely to drop below 4% in 2024
Buyers holding out for lower mortgage rates in 2024 may be disappointed, as they are unlikely to decline much further this year, even if inflation and the Base Rate edge lower.
Our Executive Director of Research, Richard Donnell, says: ‘Expectations of lower interest rates are already priced into fixed rate mortgages today.
‘Lower interest rates would likely result in further modest declines in mortgage rates but how far depends on how low money markets see base rates falling.
‘Economists currently expect base rates to fall to 3.5% by the end of 2025, which would imply mortgage rates remaining in and around the 4%+ range.’
Why are mortgage rates going down?
Mortgage rates began to go down in the latter half of 2023, as inflation dropped from 6.3% in September to 4.2% in December.
In June this year, inflation hit its 2% target, but it has risen slightly since then and is currently sitting at 2.2%.
However, the Bank of England held the base rate at 5.25% 7 times in a row, until it met in August this year, when it lowered it to 5%.
By the end of 2025, it's expected to lower it to 3.5%.
The bank rate determines the interest rate the Bank of England pays to commercial banks that hold money with them. It influences the rates those banks charge people to borrow money or pay on their savings.
What factors affect interest rates?
Inflation is the main reason interest rates have been high in the UK over the last 30 months. An unexpected rise in demand - or decrease in supply - can cause inflation to rise.
At the end of 2021, the Bank of England began to raise the base rate in order to reduce inflation and help slow down price rises for everyday items including food, petrol, gas and electricity.
It has worked - and inflation is currently hovering around its 2% target, but the Bank of England needs to keep the base rate high enough to ensure inflation doesn't rise again.
Global shocks can also have an impact on inflation, such as wars, pandemics or the blockage of major transport routes like the Suez Canal, as they affect the flow of goods around the globe.
How buyer affordability could improve in 2024
All that said, there are other ways in which buyer affordability is likely to improve this year: and that’s wages rising while house prices hold steady.
This trend is happening already, and it’s improving confidence among buyers.
‘Rising household disposable incomes are expected to be the primary driver of improved housing affordability over 2024,’ says Donnell.
‘Disposable incomes are projected to increase by 3.5% over 2024, while house prices look set to remain broadly flat over the year.’
In fact, momentum in the housing market is already ticking up and the number of sales agreed has climbed 9% year-on-year.
This, in turn, is encouraging more sellers to come to market, improving the choice available for buyers.
More choice for buyers in 2024
There are now more homes for sale than at any point in the last six years. This is improving choice for home buyers and supporting more sales.
The average estate agent has 33 homes for sale, which is 16% higher than a year ago.
More supply means more sellers, most of whom are also buyers.
And more choice for buyers means more opportunity for wriggle room when it comes to paying the asking price.
‘Our view is that a greater availability of homes for sale will keep price rises in check,’ says Donnell.
‘This means buyers have more choice and room to negotiate, especially where homes are failing to attract buyer interest in a timely manner.’
Affordable areas remain popular with buyers
While momentum is up among buyers and sellers across the UK, in more challenging mortgage rate times, it’s the affordable areas that are proving to be the biggest draw for buyers.
‘Sales activity is up across the board, with the strongest growth in sales taking place in areas with more affordable house prices, such as Yorkshire and the Humber (11%) and the North West (13%),’ says Donnell.
Meanwhile, the strongest growth in new sellers listing homes can be seen in the South West (28%) and North East (26%).
Over in the capital, the supply of homes for sale is just 8% higher, which means house prices are rebounding faster here than other parts of the UK, as more buyers compete for properties.
Asking price discounts narrow as house prices hold steady
While it remains a buyers’ market right now, buyers should know that the discounts being offered by sellers are starting to get smaller.
UK buyers are currently paying 96.8% of the asking price, which is up from 95.6% last October.
In value terms, this averages at £16,600 below the asking price for sales agreed in June 2024, compared to £23,000 below the asking price in October 2023.
There continues to be a north/south divide in house prices, with homes in the south continuing to register house price falls as homes in the north see house price growth.
But all areas are recording higher annual price inflation than six months ago, as sales volumes recover and pricing levels firm.
So while there’s still room to negotiate, house prices are starting to hold steady in 2024 and we don’t expect to see a further fall in property prices this year.
Key takeaways
- Mortgage rates expected to stay in and around 4+% for the rest of 2024
- House prices will hold steady as rising wages improve affordability
- There are now more homes for sale than at any point in the last six years
- The Base Rate is expected to fall to 3.5% at the end of 2025
What are the fastest-selling homes in the UK?
Looking to sell and sell fast? Learn which homes in the UK are being bought the quickest within 30 days of hitting the market.
Half of sales agreed happen within 30 days of listing
When it comes to house sales, you’d be forgiven for thinking that they all take a lengthy amount of time. But according to our research, this isn’t always the case. We found that 49% of sales agreed in England and Wales occur within 30 days of the home being listed for sale. In Scotland, the stats are even more impressive, with 75% of homes being sold within a month. This is because homes there are marketed with a valuation and survey upfront, which tend to allow for a faster time to agree a sale.
Ultimately, how fast a home will sell can only be judged on a case-by-case basis. It depends on the asking price, property type, size, condition and local demand for each type of home. Setting the right asking price from the start is perhaps the most important to securing a faster sale. In England and Wales, the current gap between the fastest and slowest-selling property types is almost 2 weeks.

What’s the fastest-selling property type?
Between April and June 2024, 2-bed terraced homes were the fastest-selling property type on Zoopla in England and Wales.
The average time to agree a sale on this property type is 27 days, which is 5 days faster than the national average of 32 days. To complete a sale, sellers typically need another 4 months, depending on the complexity of the transaction.
In the past 3 months, 6 in 10 of sales agreed for 2-bed terraced homes were within a month of listing.
Why do they sell so fast you ask? The simple answer is that 2-bed terraced homes appeal to various types of buyers. They're a good value-for-money option for first-time buyers with limited funds, and for downsizing empty-nesters who aren’t ready to give up features like a garden.
They’re also relatively rare. Only 7% of homes that came on the market in the last 3 months were 2-bed terraces. This drives up the competition.
2-bedroom terraced homes have consistently been the fastest-selling type of home in more expensive regions (London and East of England) over the last 6 years. Now, they’re also the fastest-selling type of home in more affordable regions. This signals a shift in buyer requirements in the face of higher borrowing costs.

What are the four types of homes most likely to sell within 30 days?
2-bed terraced homes aren’t the only property type to sell quickly. The other types of homes that sell the fastest within a month are:
-
2-bed semi-detached homes
-
3-bed terraced homes
-
3-bed semi-detached homes
Collectively, these four property types make up 46% of UK homes, but only 32% of all homes listed for sale. This mismatch signals an undersupply of more affordable family homes, which encourages stronger competition amongst buyers. People looking to sell these types of homes can expect more early offers than owners of larger houses and flats - as long as they price their homes correctly.

What’s the slowest-selling property type?
Detached homes with 4 bedrooms or more take the longest time to find a buyer, with an average of 40 days. This is 13 days slower than 2-bed terraced homes.
Earlier this year, we reported a spike in supply of 4-bed homes for sale, boosting the choice for those looking to buy large homes. This, combined with weaker demand due to higher mortgage rates, means buyers take longer to decide to buy larger homes.
What are the regional variations in time to sell a home?
Our research also shows local variations in time to agree a sale, with available stock type, demand and pricing playing a role.
The popularity of 2-bed terraced homes is most evident in the South West, Yorkshire and the Humber, West Midlands and parts of the London commuter belt.
Flats, which typically take longer to sell than houses, are the fastest-selling property type in the North West, particularly in Manchester, Liverpool and Warrington.
Moving away from the UK's major cities, 3-bed homes are still the fastest-selling.
Detached houses with 4 bedrooms or more are currently the slowest-selling, but we also find examples of terraced and semi-detached homes with the same number of bedrooms to be the fastest-selling homes. This includes parts of Cambridgeshire, mid-Wales, Northamptonshire and the Scottish Highlands.
What’s next for time to sell?
How long it takes to sell a home varies from season to season. Typically, homes sell a week faster in the first six months of the year and we can expect fewer homes to achieve a sale within 30 days in the coming months of 2024.
Mortgage rates have fallen to an average of 4.5-5% which is enough to support more sales. A cut to the base rate this year could boost market sentiment, and support demand and the pace at which sales are agreed.
Homes that are not well-presented or priced incorrectly for the local market will continue to take longer to achieve a sale or may not sell at all. Homes that have had to undergo an asking price reduction of 5% or more are taking an average of 70 days to agree a sale, which is over 2x the average. This shows the importance of talking to local estate agents to decide on the most suitable asking price. It gives you the best chance to attract buyer demand and boost the possibility of getting a sale agreed.
Key takeaways
- 2-bed terraced homes are the fastest to achieve an offer as 6 in 10 sell within 30 days
- Larger, detached homes with 4 bedrooms or more take 40 days to sell on average
- Time to sell varies by location, with available stock type, demand and pricing playing a role
- We expect homes to sell at a slower pace over the second half of 2024 as buyer demand decreases in later months of the year
Bank of England cuts base rate: what does this mean for mortgages?
The base rate has been cut for the first time in four years and now sits at 5%. Let's take a look at what this means for mortgages and the housing market.
What’s happened to the base rate?
The Bank of England has cut the base rate by 0.25% to 5%. Base rates have been stuck at 5.25% for 11 months having risen rapidly from a low of 0.1% in November 2021. Higher base rates were needed to control inflation which is now back in line with the Bank’s target of 2%.
The decision to cut the base rate by 0.25% was finely balanced, but will be welcome news for businesses and households alike. It’s a sign that borrowing costs are likely to fall further - though how much further remains to be seen.
As we look to next year, city economists are forecasting that it’s likely the base rate will fall to 4.6%–4.7% by the end of 2025.

What does the base rate cut mean for mortgages?
The cost of a mortgage is not directly set by the Bank of England official base rate. Lenders mainly source their finance for fixed rate mortgages in the money markets. The cost of this money is influenced by the expected direction of base rates, amongst other things. Most borrowers using a mortgage to buy a property are on fixed rate loans for 2 or 5 years.
Uncertainty over the outlook for the base rate over the last 3 years has led to the mortgage rate rising and falling between 4% and 6% for a typical 5 year fixed rate at 75% loan to value (LTV). These fluctuations have been driven by financial markets and their expectations for future borrowing costs.
At the start of 2024, there were expectations of several base rate cuts over the second half of the year. These expectations have been scaled back, and this explains why average mortgage rates have risen back above 4.5% for 5 year fixed rate loans in recent months.
Today’s cut to the base rate may lead to mortgage rates returning to where they were earlier in the year. However, this depends on what the city thinks will happen to base rates into 2025.

How will this impact home buyers and the housing market?
The housing market is steadily adjusting to higher mortgage rates, with the worst of the impact felt in 2023.
2024 has got off to a good start: households that put decisions on hold last year have returned to the market knowing that base rates aren’t going to rise any higher.
The housing market is on track for 10% more homeowners moving compared to last year, and Zoopla expects average house prices to be 2% higher by the end of the year.
A key sign of confidence returning to the sales market is that buyers are paying almost 97% of the asking price. This is the highest it’s been for 18 months.
Mortgage rates of 4-5%, while higher than the ultra low rates of 2019-2021, are becoming more manageable for home buyers. This is demonstrated by more sellers and more sales being agreed. Further growth in household incomes will help improve affordability, especially as we expect incomes to rise faster than house prices over the next 18 months.
What’s the impact on the mortgage market?
The mortgage market remains very competitive with lenders offering a wide range of mortgage deals for all types of buyer. Rates are changing all the time and responding to the outlook for the cost of borrowing.
If you’re looking to take out a new mortgage within the next six months, you can approach individual banks and building societies to find out their best rates. Or, you can work with a mortgage broker who will scour the market to find the best deals available to you.
Mojo Mortgages is part of the Zoopla family and works with over 70 different lenders across thousands of mortgage products.
Mojo won’t charge you for their services, because they charge the lender you choose to go with instead.
And if mortgage rates drop between now and the time your deal is due to start, you can ask them to rescan the mortgage market for you.
Key takeaways
- Base rate cut to 5% after 11 months at 5.25%
- This cut is expected to deliver a confidence boost for home buyers
- Average mortgage rates have already fallen this year
- Fixed rate mortgages already factor in outlook for the base rate and are set to remain in 4-5% range into 2025

Are you paying too much for your mortgage?
27% of homeowners with a mortgage are on their lender’s standard variable rate. Could you be one of them?
When your mortgage deal period ends, you’ll normally move onto your lender’s standard variable rate.
A standard variable rate (or SVR) is usually a lot higher than your existing rate. Currently the average is averaging out at 8.65% across all lenders, and it can change at any time your lender decides.
Some lenders move you onto a ‘follow on’ rate instead, which can be even higher than their standard variable rate.
According to recent research by mortgage broker Habito, one in 10 mortgagees believe that paying a more expensive rate on their mortgage meant they’d be paying off their mortgage quicker.
It doesn’t. It simply means you’re paying the lender more interest instead.
Your lender will be able to tell you in advance what your monthly payment will be once your current deal ends.
How much more expensive is a lender’s standard variable rate?
An SVR or ‘follow on’ rate can be between 2% and 3% higher than the average five-year or two-year fixed rate mortgage.
And the lender can raise the rate at any time.
When the Bank of England increases the Base Rate (which it has done 14 times since December 2021) SVR and tracker rate mortgages may increase too, as they usually follow the Base Rate.
However there are exceptions. And some lenders have opted not to increase the rate on their SVR mortgages when the Base Rate has risen.
Your lender will always let you know what’s happening with your mortgage rate.
Current SVRs and fixed rate deals from major lenders
Let’s take a look at the standard variable rate and fixed rate mortgage deals currently being offered by some of the major lenders.
|
Lender |
SVR |
5-year fixed |
2-year fixed |
|
Barclays |
8.74% |
4.5% |
4.95% |
|
Halifax / Lloyds |
8.74% |
4.32% |
4.67% |
|
HSBC |
6.99% |
4.28% |
4.79% |
|
Nationwide |
7.99% |
5.04% |
4.32% |
|
Santander |
8.25% |
4.37% |
4.78% |
|
The Mortgage Works (buy to let) |
8.49% |
4.49% |
4.79% |
|
Virgin Money |
9.49% |
4.64% |
5.14% |
|
Yorkshire BS |
7.99% |
4.43% |
4.77% |
If you had a £200,000 mortgage spread over 25 years on a £250,000 property, you could end up paying several hundred of pounds more in interest each month on the lender’s SVR.
To cite Virgin Money’s rates above as an example:
On the standard variable rate of 9.49%, you’d be paying £1,746 a month.
At the two-year fixed rate of 5.14%, you’d be paying £1,185 a month.
With the five-year fixed rate of 4.64%, you’d be paying £1,127 a month.
That’s a potential difference of £619 a month, or £7,428 a year, between a lender’s standard variable rate mortgage and fixed rate deal.
Use our mortgage calculator to work out what your monthly payments could be.
Why are so many people on standard variable rate mortgages?
Habito’s research suggests many homeowners are slipping onto their lender’s SVR without even realising it or knowing that they have an alternative.
But it’s always worth contacting a broker 3-6 months before your current mortgage deal is due to end.
You can book in a new deal up to six months in advance.
And if a better rate comes up between the time you booked the deal and the time it’s due to begin, you can simply book in that rate instead.
Your mortgage broker will be the best person to advise you on what to do.
Financial concerns
One in 10 homeowners were frightened of lenders scrutinising their finances, given the current economic climate.
This is where a broker can help. They have an in-depth knowledge of the mortgage market and know the rules that different lenders operate by.
Once your broker has an understanding of your financial circumstances, they’ll know which lenders to approach on your behalf.
Unaware of mortgage alternatives
One in 10 didn’t realise it could be possible to get a cheaper mortgage deal.
A mortgage broker will scour the market for you to find the cheapest mortgage rates available to you.
Too much hassle to switch mortgages
In a recent survey by Which?, 41% of homeowners on an SVR mortgage said they’d be unlikely to switch to a cheaper deal.
They felt it ‘wasn’t worth the hassle’ or they ‘hadn’t really thought about it’.
This in part may be because homeowners with smaller mortgages are less likely to feel the financial hit when moving onto an SVR.
But when the savings can run into hundreds of pounds a month, it’s a call to a broker that’s worth making.
Fears of being in negative equity
Other homeowners were concerned that they might be in negative equity.
Negative equity is when a property you own is worth less than the mortgage you're paying on it.
What is negative equity?
Most lenders won't let people with negative equity switch to a new mortgage deal when their existing one ends. Instead, they'll normally be moved onto their standard variable rate.
You can find out if you’re in negative equity by checking the balance left on your mortgage and inviting estate agents round to value your home.
If you are in negative equity, it could still be worth speaking with a mortgage broker, as they may be able to find a lender that could help.
Mortgage rates set to stay at around 4+% in 2024
In good news for homeowners and buyers, mortgage rates are now holding steady and look set to plateau at around or just over 4% for the rest of the year.
Inflation has now come down and so have swap rates - the rates the banks pay to borrow money.
Swap rates are based on what the markets think the interest rate will be in the future.
Right now, the average mortgage rate for a 5-year fixed rate at 75% loan to value has reached 4.59%, across the big six lenders.
The reduction in swap rates will take time to feed through into mortgage rates, and our Executive Director - Research, Richard Donnell, believes mortgage rates are unlikely to drop further this year.
Will mortgage rates go down in 2024?
Whether you need to remortgage now or in six months time, if your current mortgage deal is coming to an end soon, it’s well worth contacting a mortgage broker.
They will be fully up to speed on the latest mortgage market trends and current rates available.
And they are in the best place to advise you on getting the cheapest possible mortgage deal for you.

Home values on the up in 2024
The average UK home is now worth £2,400 more than it was 6 months ago. But if you own a terraced property in the north, it's likely to be a lot more than that.
Growing buyer confidence and a rising number of sales in the first half of 2024 are translating into a firming up of home values.
Our latest estimates reveal the average UK home is now worth £278,000, up £2,400 from December 2023.
Every month, we generate value estimates for nearly 30m UK homes, using a combination of local sold and asking price data to show indicative home values.
Our data reveals half of UK homes (15 million) increased in value in the first half of 2024 by 1% or more. That’s the highest number since December 2022.
And while most of the gains are modest, a third of UK homes (10 million) went up by £5,000 in value, that’s twice the number of homes that saw this increase in 2023 (5.4 million).
In the same period, 8 million homes (27%) have kept their values broadly the same (changes within 1%).
Overall, 6.7 million UK homes have fallen in value by at least 1% since the end of 2023, a sign that some markets are taking longer to recover from the effects of higher mortgage rates.
That said, 14 million homes were losing value at the end of 2023, so it’s a step in the right direction for homeowners impacted by recent price falls.
Meanwhile, the north-south value divide continues, with fewer homes in the south gaining value, as higher prices exaggerate the impact of higher mortgage rates on buying power.

Terraced homes in the north make biggest value gains
Home values are rising fastest in northern England.
In Yorkshire and the Humber homes went up 1.4%, while in the North East they rose by 1.9%.
Overall, half of homes in northern England went up in value by £1,000 to £10,000, while 1 million homes (14%) gained more than £10,000.
Homeowners in Oldham (83%), Wakefield (77%) and Co. Durham were most likely to see their home values increase by 1% or more.
And homes under £150,000 are seeing the greatest value growth (5%+), especially terraced properties, with nearly a fifth rising by 5% or more in value.
This clearly shows that value-for-money homes are a popular choice among buyers facing higher mortgage costs.

Most expensive homes more likely to go up in value in southern regions
Pricier homes in the south have seen their values impacted by higher mortgage rates and consequently their home values are taking longer to recover.
Since the start of 2024, the typical value increase here has been below 1%. Yet nearly 6 million homes have risen by more than that - the highest number since the end of 2022.
The top 10% of the most expensive homes in the south actually saw more gains than their cheaper or average-priced counterparts.
In areas where house prices are above the average, such as West-Central London, Watford and Bath, 7 in 10 homes have risen in value, with most seeing gains of £5,000+.
However, nearly 3.5 million properties in southern England have continued to see their values fall - and many of these homes were detached.
The market for these homes suffered from a demand/supply imbalance earlier this year, as aspirational buyers continued to reassess their requirements in the face of high borrowing costs.
Will home values keep rising now?
Our expectation is for house prices to grow by 1.5% by the end of the year.
But the south-north divide is here to stay, with homes in the north showing above average growth.
Those increases are unlikely to return to pandemic levels however, unless mortgage rates fall dramatically.
Meanwhile, house prices in the south of England are expected to continue to track below the UK average as they realign with people’s incomes.
Key takeaways
- Half of UK homes (15 million) increased in value by more than 1% in the first half of 2024
- Overall, the value of the average UK home has gone up by £2,400
- And 1m homes in northern England have increased in value by £10,000 or more
- Meanwhile a further 6.7m homes have fallen in value
- And the north-south divide continues to grow, with home values rising in the north and declining in the south
- That said, higher-value homes in the south are bucking the trend and their values are still on the up