Low supply and high demand create a sellers' market
The number of properties for sale has fallen to its lowest level for more than 6 years and is forecast to remain low well into next year.
The housing market faces an acute shortage of homes for sale as the supply of properties fails to keep pace with the current buying frenzy.
One in 20 homes changed hands during the past year driven by the stamp duty holiday and the pandemic-induced search for space.
The number of homes being put up for sale is failing to replenish those that are sold, however, leading to the most acute shortage of stock since 2015 when we first began tracking this measure.
The mismatch between supply and demand has created a sellers’ market, particularly for 3 and 4-bedroom family homes, which is pushing up house prices because homeowners can command the top price for their properties.
The pace of the market is also accelerating, with homes taking an average of just 26 days to sell, nearly half the 49 days they took in 2019, as a growing number of buyers compete for limited properties.
Scroll down to get more insight from our latest House Price Index report and find out what it could mean for you.
What’s happening to house prices?
Strong demand from buyers is continuing to put upward pressure on prices, with the average UK home seeing its value increase by 6% in the year to the end of July.
The increase, which has left the typical property costing £234,000, is more than double the 2.3% rate of growth recorded in the same month of 2020.
Regions in which affordability is less stretched continue to see the strongest house price gains, with Wales leading the way with growth of 9.4%, followed by Northern Ireland at 9% and the North West at 7.9%.

A similar pattern is evident at a city level, with Liverpool, where the average home costs £136,721, going up in price by 9.4% during the past year, while house prices in Manchester and Belfast have increased 7.7% and 7.5% respectively over the same 12 month period.
By contrast, property values in London have edged ahead by just 2.5%, although the rate of growth has increased from 1.9% in March.
How busy is the housing market?
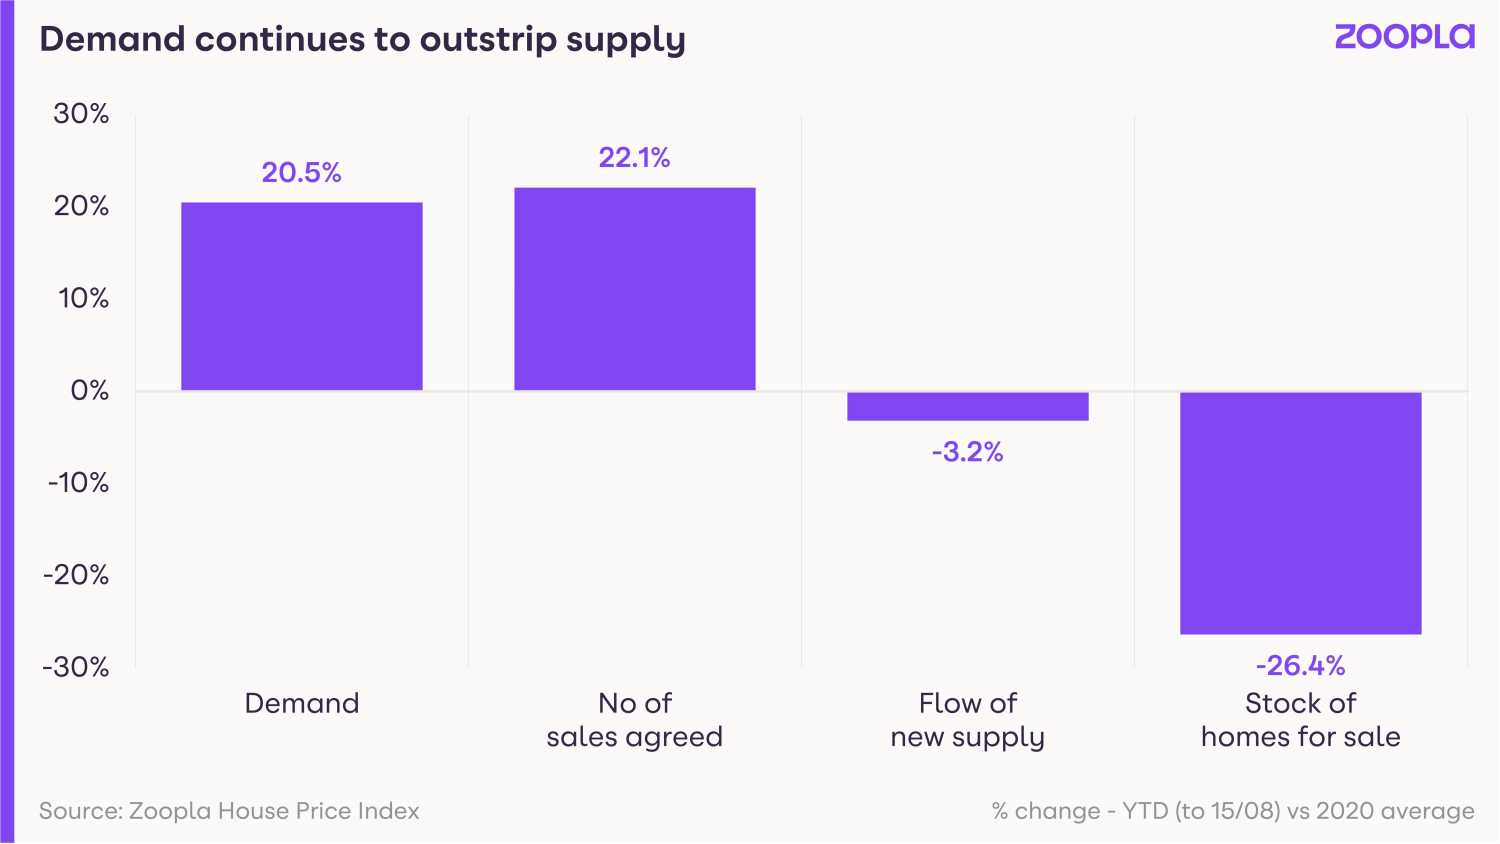
Demand from potential buyers remains elevated, with the number of people looking to purchase a home 20.5% higher than the average for 2020.
Competition among buyers has been intensifying during the second half of last year and the first half of 2021, spurred on by the stamp duty holiday.
These high levels of demand have led to a 40% increase in sales in the 12 months to the end of June.
The high level of buyers in the market is not being matched by sellers, however, with the number of homes for sale down 26.4% than the average for 2020, and 33% lower than levels seen in 2018 and 2019.
What do buyers want?
The supply constraints are most evident for houses, in particular family houses of 3 or 4-bedrooms, and properties priced up to £350,000.
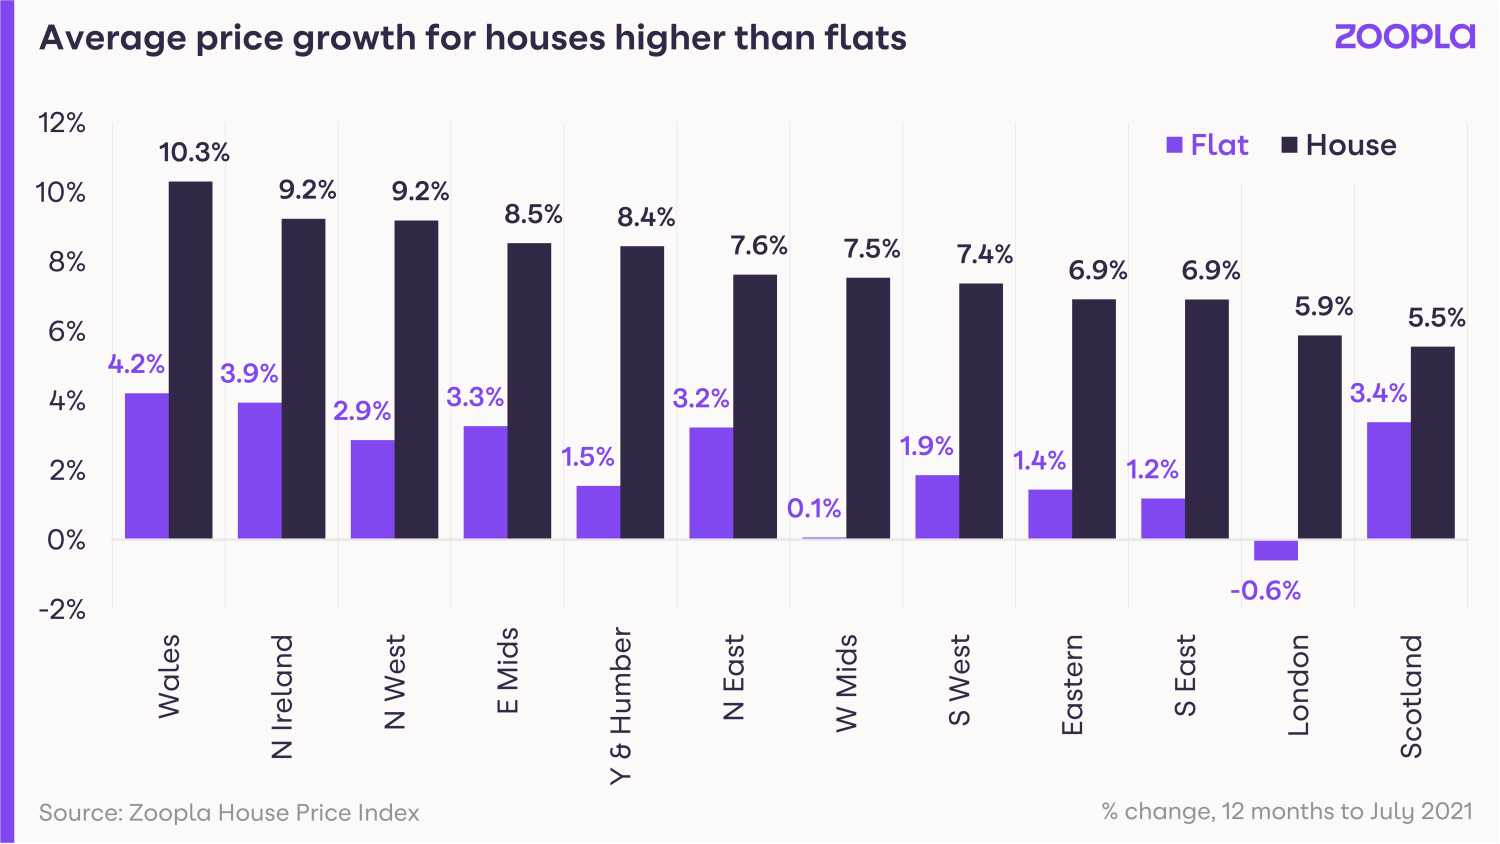
This shortage is reflected in the price of houses which jumped by 7.6% during the past year, compared with a gain of just 1.2% for flats.
Typically a homemover both buys and sells, creating demand and supply. But the current shortage is not being helped by increased activity among first-time buyers and property investors, who do not have a home to sell.
What could a sellers' market mean for you?
First-time buyers
Buying activity in this group has increased as lenders have become more willing to offer mortgages to people with smaller deposits.
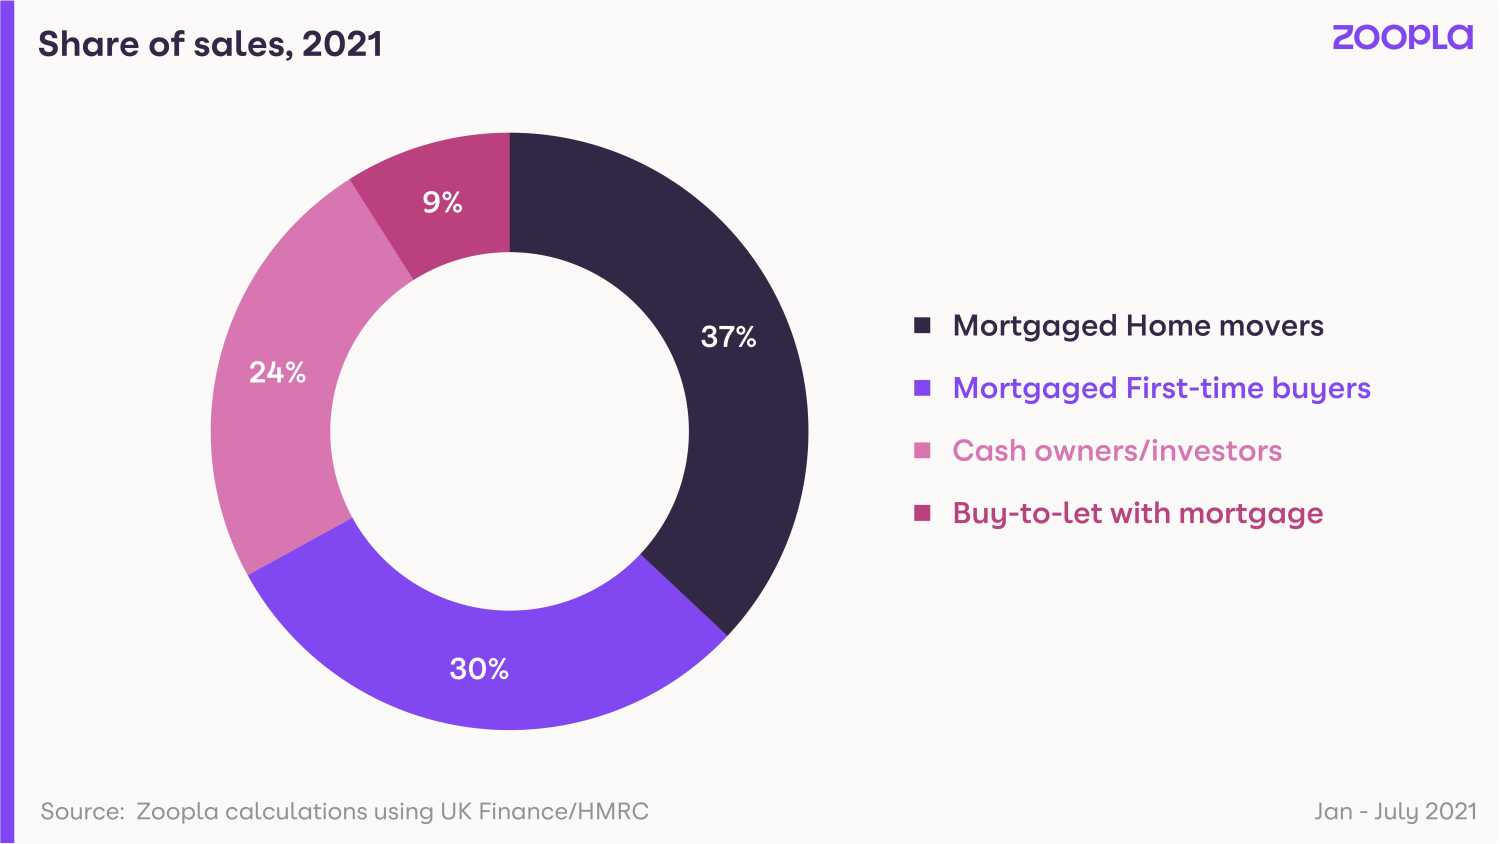
As a result, if you are looking to purchase your first home, you can expect strong competition from others trying to get on to the property ladder, with first-time buyers accounting for 30% of all sales so far this year.
The good news is that first-time buyers will continue to be exempt from stamp duty on the first £300,000 of a property purchase costing up to £500,000, even once the tapered stamp duty holiday ends.
As a result, you are not under the same pressure to find a home and complete a purchase as other buyers looking to take advantage of the tax break before the end of September, so you can afford to wait until the market cools down a bit.
Home-movers
If you have a family home that you are looking to sell you are in prime position to take advantage of the current sellers’ market and get the top price for your property.
With the market currently operating at an accelerated speed, you can also expect a quick sale.
Finding your next home is likely to be trickier, however, due to the shortage of homes for sale and intense competition from other buyers.
If you are in a position to sell your current home and delay purchasing your next one, it may be worth doing so.
Otherwise, you may want to find your next home before listing your current one.
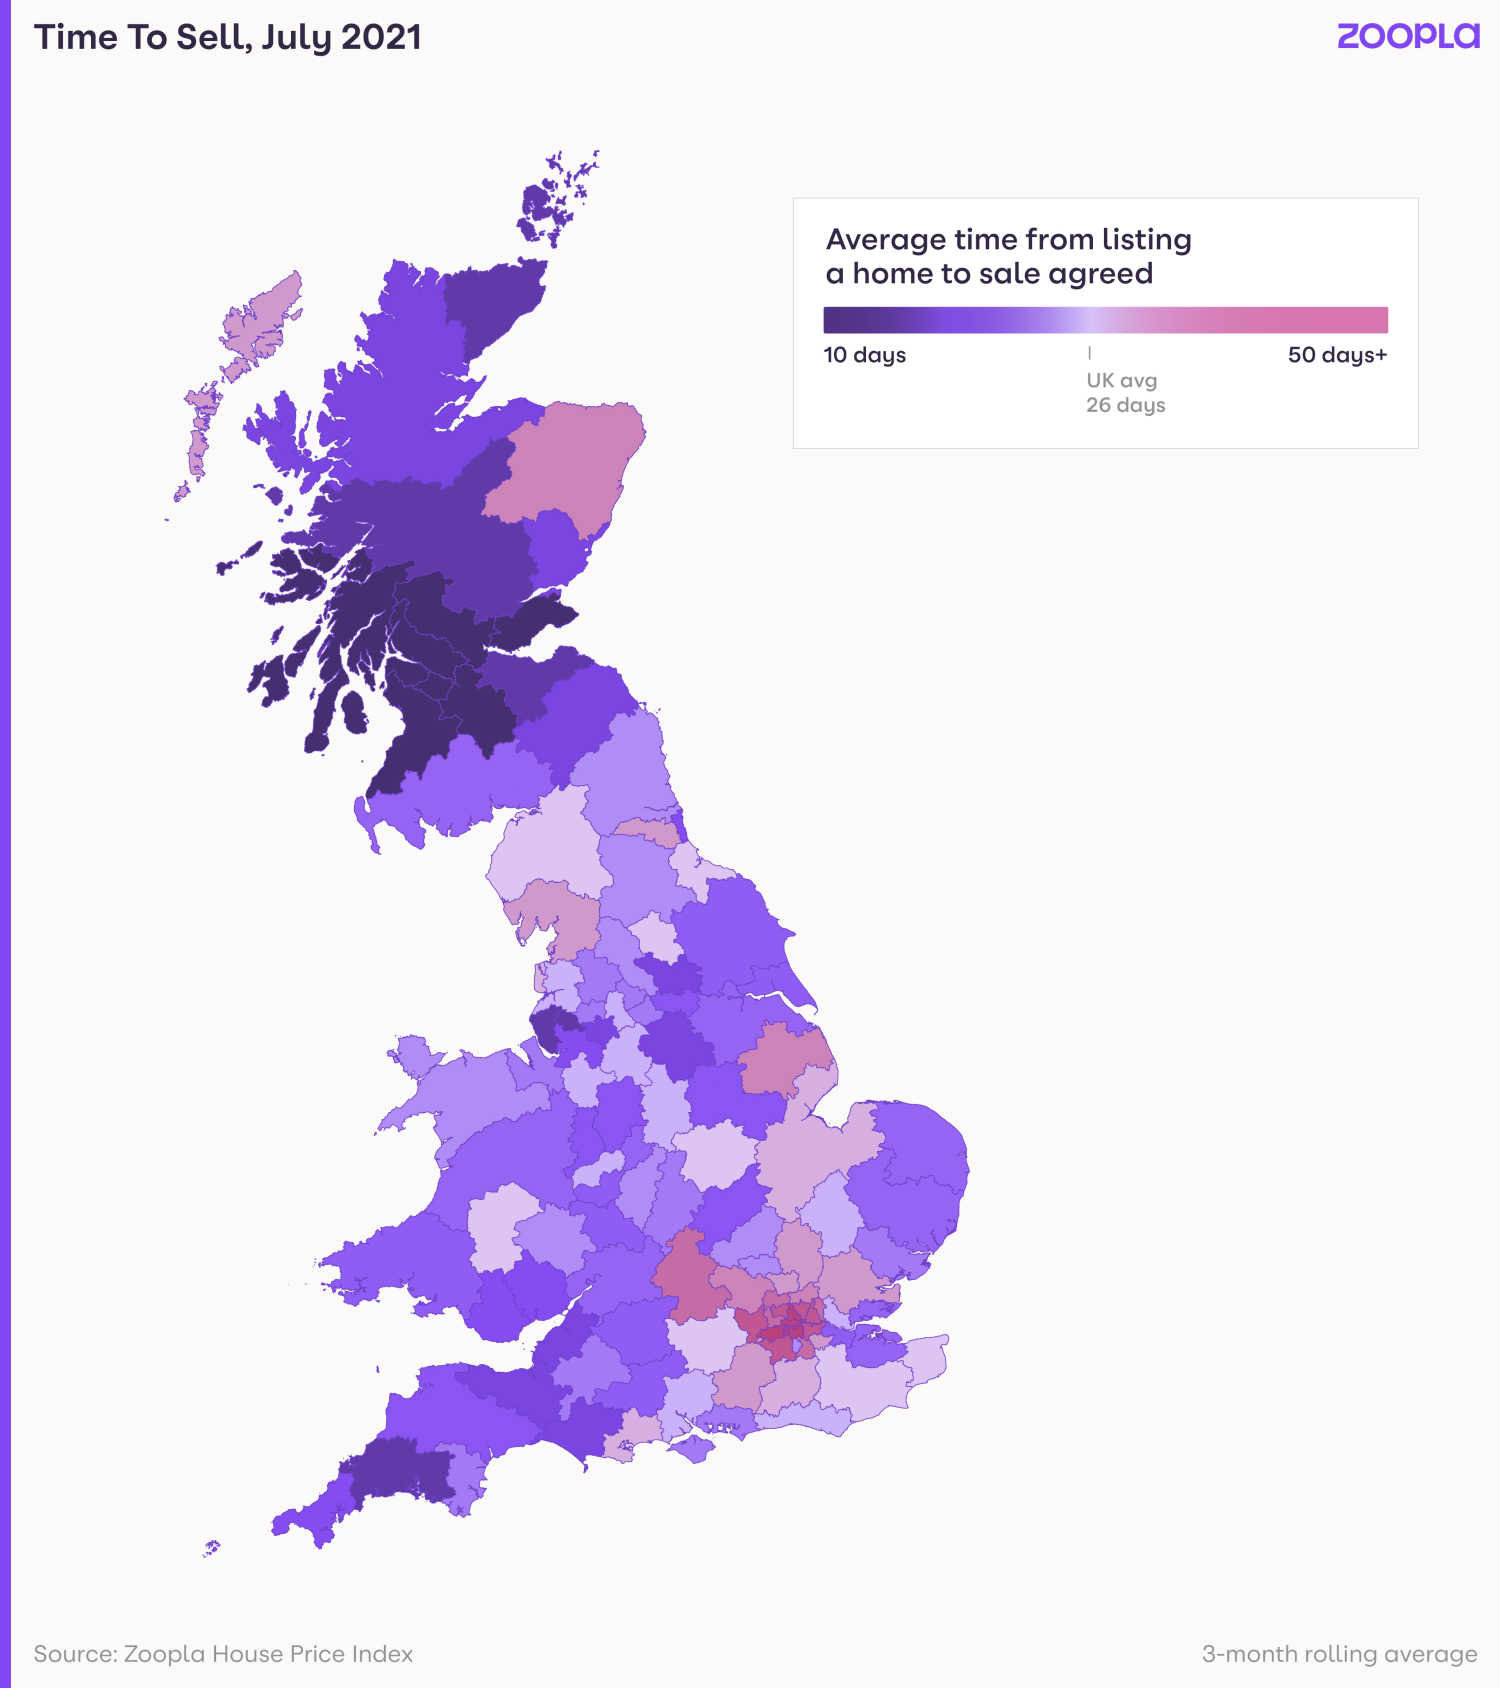
What will happen in the market next?
The shortage of homes for sale is expected to continue well into 2022, as the impact of the stamp duty holiday continues to work its way through the market.
Once this has waned and other government stimulus measures related to the pandemic, such as the furlough scheme, have been withdrawn, levels of housing stock should begin to gradually recover.
In the meantime, low levels of available homes is likely to lead to a slowdown in the market towards the end of this year and into early next year.
As a result, house price growth is expected to ease back from its current rate of 6%, to between 4% and 5%.
Head of research, said: “The post-pandemic ‘reassessment of home’, with households deciding to change how and where they live, has further to run, especially as office-based workers receive confirmation about flexible working, allowing more leeway to live further from the office.
“However, the lack of supply, especially for family houses, means the market will start to naturally slow during the rest of this year and into next year, as buyers hold on for more stock to become available before making a move.
“As we move into 2022, there will be a strong start to the year in line with seasonal trends, but after that, a return to more usual levels of activity among first-time buyers, the effect of the ending of the stamp duty holiday, and some buyers waiting for more stock to become available will result in a slow repairing of stock levels through the first half.”
Record numbers use government's Help to Buy scheme
More than 55,000 households used the government initiative to purchase a home in the past year.
A record 55,649 households used the government’s Help to Buy equity loan scheme to purchase a property in the year to the end of March.
The initiative enables people in England to purchase a new-build home with just a 5% deposit, which the government tops up with a 5-year interest-free equity loan worth 20% of the property’s value, rising to 40% in London.
A total of 328,506 households have benefitted from the scheme since it was first launched in April 2013, with the government providing a £20.1bn-worth of equity loans, according to the Ministry of Housing, Communities and Local Government.
The scheme was changed in April this year and is now only available to first-time buyers, while regional price caps on the value of homes that can be purchased through it have also been introduced.
Why is this happening?
Help to Buy has been hugely popular among people trying to buy their first home and those trading up the property ladder. The number of properties purchased through it have been on a steady upward trajectory since it was launched.
The increase in purchases during the past year is likely to reflect the buoyancy in the wider housing market, as people reassessed their housing needs following the Covid-19 pandemic.
At the same time, the fact the initiative in its original form was due to close to new buyers on 31 March, is likely to have further increased the number of people taking advantage of the scheme.
Who does it benefit?
Although Help to Buy in its original form was open to both first-time buyers and existing homeowners, 82% of people who used the scheme in the year to the end of March were taking their first step on the property ladder.
Half of the properties purchased cost £250,000 or less, while 49% of those using the scheme had a household income of between £20,000 and £50,000, suggesting the initiative was reaching those who would have struggled to buy somewhere without help.
To qualify for the new version of the scheme, you and anyone you are purchasing a property with must never have previously owned a home in either the UK or abroad.
You will also have to ensure the property you are buying is below the new region price caps that have been introduced, which range from £186,100 in the northeast to £437,600 in the southeast. The price cap in London remains unchanged at £600,000.
What other help is available?
Help to Buy is one of a number of government initiatives to help people get on to the property ladder.
The recently launched First Homes scheme enables local first-time buyers and key workers to purchase a property at a discount of between 30% and 50% of its market price, while Shared Ownership enables first-time buyers to purchase a stake in a property and pay rent on the portion they do not own.
Earlier this year, the government launched the 95% mortgage guarantee scheme to increase the availability of mortgages for people with only a 5% deposit.
Meanwhile, first-time buyers saving for a deposit can use the Lifetime ISA into which they can save £4,000 each tax year, with the government contributing 25p for every £1 they save, giving a maximum tax-free bonus of £1,000 a year.
Even though the transition phase of the stamp duty holiday is coming to an end on 30 September for the wider housing market, first-time buyers will not have to pay the tax on the first £300,000 of a property costing up to £500,000 from 1 October 2021 onwards.
Stamp duty payments soar 90% despite tax holiday
The amount of tax paid by people buying a new home has nearly doubled compared to last year, despite more than half of buyers benefitting from the stamp duty holiday.
People buying a home in England and Northern Ireland paid a total of £2.06bn in stamp duty in the 3 months to the end of June, up 90% on the same period of 2020.
The jump in payments came despite the impact of the stamp duty holiday, which ended on 30 June 2021, during which the tax was not charged on homes costing up to £500,000.
Only 37% of buyers in the 3 months to the end of June 2021 were liable for stamp duty, according to HM Revenue & Customs.
By contrast, 64% of buyers were liable for the tax in the same period of 2020 (before the holiday was introduced), resulting in a payment of £1.9bn in tax duty - almost half what was paid by a smaller percentage of buyers in 2021.
Why is this happening?
The steep increase in the amount of stamp duty being paid has been driven by soaring property transactions, as people took advantage of the threshold at which stamp duty kicked in being raised to £500,000.
There was a 175% jump in the number of homes changing hands during the 3 months to the end of June, as people rushed to complete their purchase before the full stamp duty holiday ended, according to HMRC.
It also led to a significant rise in the number of people buying homes costing more than £500,000, as they were still able to make significant stamp duty savings, despite being charged the tax at a rate of 5% on the portion of their purchase costing between £500,001 and £925,000,10% on the portion between £925,001 and £1.5m, and 12% on the portion above £1.5m.
A total of 59,600 properties were bought for more than £500,000 in the 3 months to June 2021, compared with just 13,000 a year earlier, with these higher rates of stamp duty making a significant contribution to the total amount of the tax paid.
A further £485m was paid by people purchasing a second home or buy-to-let property, as the 3% surcharge on these homes was not covered by the stamp duty holiday.
At the same time, a new 2% stamp duty surcharge was introduced for overseas buyers purchasing a property in England or Northern Ireland on 1 April, which raised £19m.
What could this mean for you?
While the full stamp duty holiday on homes up to £500,000 has ended, you still have time to take advantage of the tapered stamp duty holiday.
If you can complete the purchase of your property by 30 September 2021, you will not have to pay stamp duty on the first £250,000 of the purchase.
Once the conveyancing process starts, be sure to respond to any questions or requests for documents from your solicitor as soon as possible to give yourself the best chance of completing on time.
And remember, if you are a first-time buyer, you do not have to pay stamp duty on the first £300,000 of your purchase, as long as your home costs less than £500,000.
What’s the background?
Not only did the stamp duty holiday lead to a sharp increase in the number of homes being sold, but the mismatch between supply and demand also led to strong house price growth.
As a result, an estimated 1.8m properties have been pushed into a higher stamp duty band, according to our research.
An estimated 940,000 properties have moved into the 5% stamp duty band, while 130,000 have moved into the 10% band.
The change will cost buyers purchasing a home in the 5% band an additional £725 on average once the tapered stamp duty holiday ends, while those purchasing a home in the 10% band can expect to pay £6,100 more.
Whose house price have you snooped on?
From family and friends, to colleagues and even ex-partners, we reveal whose house prices Brits secretly look up – and how you can track down yours.
Keen to find out what your boss forked out for their sprawling house? Or fancy checking out the price tag of your ex-partner’s shiny new pad?
If so, you’re in good company. Nearly 6 out of 10 Brits admit to secretly looking up how much someone they know has paid for their home.
Yes, a whopping 59% of people we surveyed have snooped on the property price of a friend, relative, colleague or even potential partner.
But only 19% of people think it is acceptable to ask someone what they paid for their home. And 65% say they would never admit to the owner that they had looked up the value of their property.
How did people react after checking out someone else's house price?
A third of Brits admitted they had continued dating someone they otherwise would not have after finding out how much their home was worth.
And a further 50% said it 'encouraged' them to keep seeing someone.
But 24% of people dumped someone after viewing their home online.
Putting romance aside, 11% of Brits confessed they felt jealous after finding out how much someone they knew paid for their home.
But 10% said they respected someone more and 9% said they liked them better after looking up their house price online.
Why are Brits nosy about house prices?
The main reason people looked up someone else’s house price was to get a better idea of what their own property was worth, with 23% of the 2,000 people we surveyed citing this.
Fancy finding out what your home could be worth? Use My Home to get an instant estimated value of your property and discover how much you could have made on it.
Around 18% of people who checked out the sale price of someone else’s property said they did so to find out what their home looked like on the inside, while 12% were motivated by nostalgia and wanted to see pictures of their previous home.
Some people were motivated by improving their own property, with 10% wanting to see what different layouts or extensions would be feasible for their home, and 9% claim they were looking for interior design inspiration.
Meanwhile, 8% of those who had looked up sale prices said they wanted to gauge if it was a good time to put their home on the market.
What could it mean for you?
Tom Parker, consumer spokesperson, said: “Buttoned up Britons love talking about house prices – but for most, asking someone straight-up what they paid for their home is still considered a taboo.
“But how much a house sold for is publicly available information and is easy to source online. Whether it’s your boss, a friend or even a potential partner, it’s clear we want to know more about the homes they live in and will often treat them differently as a result.”
Key takeaways
- A whopping 59% of Brits admit to checking out how much someone they know has paid for their home.
- People are most likely to find out what their neighbours, friends and family have forked out for their home. But 3% have looked up the price of their boss’ pad.
- Nearly a third have continued to date someone they wouldn’t have otherwise after viewing their home online, while a quarter have dumped someone as a result of it.
- The main reason people found out the value of someone else’s home was to get a better idea of what their own property was worth.
Demand for houses doubles as buyers search for more space
Whether you’re a first-time buyer or a homeowner looking to move up the housing ladder, here’s how the surge in popularity for houses could impact you.
In search of a spacious new home? You’re not the only one. Demand for houses has more than doubled as buyers search for more space in the wake of successive lockdowns.
Family houses are the most sought-after type of property, with the number of buyers looking to snap one up soaring by a whopping 114% compared with levels typically seen at this time of year between 2017 and 2019.
But while demand for all types of houses, from terraced to detached, has more than doubled, the number of buyers looking to purchase a flat has risen by only 34%, according to our latest House Price Index report.
This has led to the average cost of a house jumping by 7.3% during the past year, while the typical price of a flat has edged ahead by just 1.4%.
In fact, price growth for houses has outstripped flats across all regions of the country
But the greatest disparity has been seen in Wales, where the cost of a house has risen by 10.2% year-on-year, while the price of a flat has edged up by just 0.9%.
Why is this happening?
On the one hand, demand for houses has been stoked by the stamp duty holiday, with bigger savings on offer for larger properties (typically houses).
But it also reflects a surge in buyer interest for more space, with successive lockdowns driving people to reassess their homes and lifestyles.
At the same time, the trend for working from home has prompted people to leave city centres in favour of more rural locations, which are more likely to consist of houses rather than flats.
What could it mean for you?
First-time buyers
It could be good news if you’re a first-time buyer purchasing a flat rather than a house. The cost of flats has risen much more slowly than property values across the wider housing market during the past year.
It's worth remembering that there's significant variation across the regions though. Price growth for flats is down 0.5% in London during the past 12 months, while it's up 5.2% in Scotland.
If you're a first-time buyer eyeing a house, be prepared to face stiff competition. However, with no property to sell, you have an advantage over buyers in a property chain.
And remember that there are schemes available to help make buying your first home more affordable, such as first-time buyer stamp duty relief and Help to Buy.
Home-movers
Soaring demand for houses means that if you are planning to sell a house, you could be in a good position to secure a quick sale.
You are likely to have seen it’s value rise during the past year too. Price growth for houses has been particularly strong in Wales and the north west, where it has jumped by 10.2% and 8.8% year-on-year respectively. It’s been weakest in London, where it has increased by 5.6%.
But if you are selling a flat, you may find the gap between the value of your current home and the house you want to purchase has widened in recent months.
Head of research, explained: “There is a continued drumbeat of demand for more space among buyers, both inside and outside, funnelling demand towards houses, resulting in stronger price growth for these properties. Sellers will need to consider this when it comes to pricing expectations.”
Regardless of the type of property you are selling, if you are looking to purchase a house, you are likely to face stiff competition from other buyers.
So it's important to do your homework and be prepared to move quickly when you find something you like.
Key takeaways
- Interest in houses for sale has more than doubled as the pandemic drives buyers to search for more space.
- The number of people looking to snap up a family house has soared by 114% compared with levels typically seen at this time of year between 2017 and 2019.
- The average cost of a house has jumped by 7.3% during the past year, while the typical price of a flat has edged ahead by just 1.4%.
What’s the outlook?
While buyer demand for all property types has eased slightly, it remains up 80% compared with typical levels for this time of year.
But these high levels of demand are not being matched by the volume of homes on the market. And this means that buyer competition for houses is set to remain intense.
According to our research, house price growth for all property types is expected to hit 6% in the coming months.
But as the stamp duty holiday ends and economic conditions become more challenging, it’s set to fall back to between 4% and 5% by the end of the year.
Property hotspots: top areas for long-term house price growth
With UK house prices nearly tripling over the last two decades, how much could you have made on your home?
UK house prices have nearly tripled since 2001, with the value of the average home soaring by a massive £163,700.
Homeowners who purchased a home before the global financial crisis saw a dip in its value between 2008 and 2012.
But these losses have been offset by strong house price growth since 2013, according to our latest research.
Where have house prices increased the most?
Kensington & Chelsea in west London has been crowned the number one property hotspot for long-term house price growth.
Homes in the exclusive London borough have soared by nearly £740,000 in the past 20 years, making it the top-performing area for house price growth of any region since 2001.
It means that the average cost of a property in Kensington & Chelsea now stands at £1.1m, after prices rose by £380,200 since 2011 and £739,800 since 2001.
The commuter hotspots of St Albans and Elmbridge saw the strongest growth in the east of England and south east respectively, with property values climbing by more than £402,000 in both locations over the past two decades.
Trafford, an easy drive from Manchester, boasted the biggest house price rises in the north west. Meanwhile, rural areas took the top spot in other regions, such as Monmouthshire in Wales.
| Area | Region | Average house price (May 2021) | Average house price growth over 10 years (since May 2011) | Average house price growth over 20 years (since May 2011) |
|---|---|---|---|---|
| Kensington & Chelsea | London | £1.1m | £380,200 | £739,800 |
| St Albans | East of England | £624,000 | £221,900 | £402,300 |
| Elmbridge | South east | £639,500 | £220,300 | £402,200 |
| East Dorset | South west | £433,600 | £141,500 | £273,500 |
| Trafford | North west | £341,000 | £112,700 | £224,700 |
| Stratford-on-Avon | West Midlands | £338,300 | £102,500 | £206,500 |
| South Northamptonshire | East Midlands | £329,300 | £116,800 | £205,900 |
| York | Yorkshire & the Humber | £292,000 | £67,700 | £188,500 |
| Monmouthshire | Wales | £283,400 | £79,400 | £183,500 |
| Newcastle upon Tyne | North east | £164,400 | £20,300 | £99,900 |
| Scottish Borders | Scotland | £162,500 | £15,000 | £97,900 |
Research
What's happened to house prices in your area?
House prices in the south have risen the most during both the past 10 and 20 years, with southern regions occupying all of the top four spots.
Perhaps unsurprisingly, London led the way, with homes in the capital increasing in value by an average of £201,300 since 2011 and £337,400 since 2001.
To find out how house prices have changed in different areas of London over the last two decades, scroll further down our article.
At the other end of the scale, homes in Northern Ireland have seen the smallest price increases during the past 20 years, with gains of only £69,600.
And homes in the north east have increased in value the least since 2011, at an average of just £13,300.
| Region | Average house price (May 2021) | Average house price growth over 10 years (since May 2011) | Average house price growth over 20 years (since May 2001) |
|---|---|---|---|
| London | £495,400 | £201,300 | £337,400 |
| South east | £363,100 | £123,400 | £227,100 |
| East of England | £321,000 | £114,900 | £210,900 |
| South west | £284,500 | £82,800 | £180,100 |
| East Midlands | £211,500 | £65,600 | £138,500 |
| West Midlands | £207,100 | £60,700 | £130,600 |
| North west | £183,300 | £41,600 | £117,100 |
| Wales | £178,600 | £44,200 | £116,900 |
| Yorkshire & the Humber | £174,800 | £38,500 | £113,800 |
| Scotland | £158,400 | £22,200 | £93,400 |
| North east | £135,200 | £13,300 | £81,300 |
| Northern Ireland | £153,500 | £19,000 | £69,600 |
| United Kingdom | £256,100 | £73,900 | £163,700 |
Research
Why is this happening?
Since the late nineties, price growth has been fuelled by falling credit costs, which has kept mortgage payments low as prices have risen, according to Howard Bettridge, Hampton's regional director in the south east.
He explained: "Many households are also now making lower monthly mortgage payments than they were in real terms a couple of decades ago.
"This has been coupled with a house building hangover from the aftermath of the 2007 crash which has created a lack of supply, pushing prices up, while house building is only just getting back to pre-2007 levels."
On top of these longer-term trends, the last 18 months have seen price growth fuelled by white collar workers’ lockdown savings, a stamp duty holiday, and homeowners reassessing how and where they live, Bettridge added.
"Prices in London and the south east spent much of the last decade surging away from the rest of the country. But this changed around three years ago, with value growth in the north outpacing the south."
What could this mean for you?
With UK house prices nearly tripling since 2001, many homeowners have seen significant rises in the value of their property since their purchase, according to research.
You can also use My Home to track your home and other properties you're interested in. It means that you can list your home for sale when the time is right for you.
However, long-term house price growth also means that buyers face forking out larger deposits to step onto, or move up the housing ladder.
If you're in need of a helping hand, you could consider one of the government schemes aimed at assisting buyers, such as Help to Buy and Shared Ownership. And, for first-time buyers, there's stamp duty relief available beyond the current stamp duty holiday.
Which areas of London have seen the biggest house price rises?
London boroughs with the most expensive homes have seen the highest levels of house price growth.
Kensington & Chelsea took the top spot, followed by the City of London and Westminster, where property values have risen by £739,800, £570,200 and £512,200 respectively in the past 20 years.
Barking & Dagenham, which has the most affordable homes in the capital, came bottom of the table, but even here house prices have increased by an average of £242,600 since 2001.
Overall, the typical home in all but seven London boroughs has seen its price rise by at least £300,000 in the past 20 years.
| London borough | Average house price (May 2021) | Average house price growth over 10 years (since May 2011) | Average house price growth over 20 years (since May 2001) |
|---|---|---|---|
| Kensington & Chelsea | £1.1m | £380,200 | £739,800 |
| City of London | £831,300 | £294,000 | £570,200 |
| Westminster | £780,900 | £257,000 | £512,200 |
| Hammersmith & Fulham | £755,400 | £261,200 | £501,000 |
| Richmond upon Thames | £759,200 | £274,500 | £477,900 |
| Wandsworth | £646,500 | £244,600 | £435,400 |
| Camden | £636,100 | £221,900 | £424,700 |
| Barnet | £619,400 | £217,300 | £416,900 |
| Waltham Forest | £545,700 | £255,900 | £394,700 |
| Haringey | £558,700 | £224,200 | £389,400 |
| Islington | £552,500 | £214,500 | £379,500 |
| Harrow | £573,800 | £213,000 | £377,400 |
| Hackney | £527,600 | £228,000 | £368,700 |
| Brent | £541,100 | £192,100 | £365,500 |
| Lambeth | £543,400 | £205,200 | £365,400 |
| Kingston upon Thames | £563,600 | £193,100 | £353,700 |
| Southwark | £493,200 | £214,400 | £347,700 |
| Redbridge | £502,300 | £202,100 | £345,800 |
| Bromley | £523,900 | £204,500 | £337,800 |
| Ealing | £512,800 | £201,200 | £337,500 |
| Merton | £495,800 | £191,900 | £336,900 |
| Lewisham | £458,500 | £204,600 | £326,500 |
| Newham | £437,000 | £203,900 | £315,800 |
| Hillingdon | £477,700 | £182,500 | £310,500 |
| Tower Hamlets | £451,000 | £185,000 | £308,300 |
| Sutton | £471,700 | £180,700 | £304,000 |
| Hounslow | £473,800 | £170,400 | £297,300 |
| Greenwich | £415,200 | £184,800 | £295,800 |
| Enfield | £441,200 | £166,600 | £285,400 |
| Havering | £414,800 | £168,300 | £281,000 |
| Bexley | £426,000 | £167,300 | £273,800 |
| Croydon | £412,300 | £161,600 | £265,900 |
| Barking & Dagenham | £345,300 | £149,500 | £242,600 |
Research
UK house prices hit new high
Average house prices are up 30% since the market peak in 2007 as successive lockdowns prompt buyers to search for more space.
The average value of a home in the UK has reached £230,700 – 30% above the previous market peak in 2007.
House prices have been driven higher by a mismatch between the number of homes for sale and surging demand from potential buyers.
And a pandemic-led clamour for more space is making family homes particularly sought-after, with demand for this type of property more than doubling during the past year alone.
Scroll down to get more insight from our latest House Price Index report and find out what it could mean for you.
House price growth continued to gather pace in June, with property values increasing at an annual rate of 5.4%. That's more than double the growth of 2.2% seen during the previous 12 months.
Northern Ireland and Wales saw the strongest house price growth at 8.6% and 8.4% respectively, the highest rates for 16 years in both countries.
At a regional level, house price growth was at its highest in the north west and Yorkshire & the Humber.
And at a city level, Liverpool, Belfast and Manchester took the top three spots. In fact, cities in northern regions, where property remains more affordable, accounted for nine of the top 10 places with the fastest house price growth.
Meanwhile, house price growth in London has been trailing the rest of the UK for eight months, and this month was no exception.
The housing market showed no sign of slowing in June, with the number of housing sales agreed running 22% ahead of average levels in 2020.
Demand from potential buyers eased slightly, dipping by 9% in the first two weeks of July after the stamp duty holiday on the first £500,000 of property ended.
But to put this into context, buyer demand remains 80% higher compared with this time of year in the more normal housing market conditions of 2017 to 2019.
In London, demand from potential buyers has polarised. In the city's outer boroughs, where there's larger volumes of houses and properties with outside space, buyer demand is a staggering 86% higher than average levels between 2017 and 2019. In contrast, in inner London boroughs, it is only up 2%.
Meanwhile, the shortage of homes for sale across the piste continued, with a 25% fall in the number of homes on the market in the first six months of this year compared with the same time in 2020.
What could this mean for you?
First-time buyers
While buyer interest for houses has more than doubled as a result of the pandemic-led search for space, demand for flats is broadly unchanged from a year ago. So it could be a good opportunity to purchase an apartment.
That said, expect to see competition from other people taking their first step onto the property ladder, with lending to first-time buyers up 25% compared with 2020.
If you're after a helping hand, the government has a number of schemes aimed at assisting first-time buyers, including Help to Buy and the new 95% mortgage guarantee.
And remember that that there's also stamp duty relief available for first-time buyers that goes beyond the current stamp duty holiday.
Home-movers
The number of homes for sale has failed to keep pace with demand from potential buyers since January, with no sign of a rebalance expected to play out imminently.
You could be in a strong position to secure a quick sale on your existing home at a good price – particularly if you own a house that's suitable for a family.
Discover how sought-after your home could be by using our handy map tool. And use our My Home experience to get an estimate of how much your property is worth to help you plan for your next purchase.
When it comes to searching for your next property, the limited number of homes on the market means you are likely to have less choice. So register with us to receive alerts whenever a property that meets your criteria is listed for sale.
You could also face stiff competition from other potential buyers. Be sure to find out from our estate agents how to put yourself ahead of the pack, from getting your paperwork in order, to lining up your mortgage brokers and solicitors in advance.
And, if more space is high on your agenda, why not see how far your budget could stretch in different areas?
What’s the outlook?
Annual house price growth is expected to reach 6% in the coming months. It’s then expected to start easing back to between 4% and 5% towards the end of the year as the second phase of the stamp duty holiday ends and economic conditions become more challenging.
Head of research explained: "Demand is moderating from record high levels earlier in the year, but remains significantly up from typical levels, signalling that above average activity levels will continue in the coming months.
"London has a two-speed market at present, with domestic demand driving price growth in the outer boroughs, while the lack of international business and leisure travel is affecting demand in the more global real estate markets towards the centre of London.
"As COVID-19 progresses at different rates across the world, unrestricted travel may not resume for some time yet, but when it does, demand will start to pick up once more."
Is your home ‘earning’ more than you?
One in five homes has increased in value by more than the average salary in the past year alone. Is it time to check how much your home could be worth?
If you're a homeowner, you could be in for a surprise.
And that’s because one in five homes has ‘earned’ more money by simply existing as bricks and mortar than the average worker has in the past year alone.
In other words, 4.6m privately-owned homes have jumped in value by more than £30,500, the average UK salary, in the past 12 months, our latest research shows.
Want to find out what proportion of homes have increased in value by more than the average salary in your area? Check out our handy tool.
What could this mean for you?
If you are thinking of moving, you may be surprised by how much your home is now worth, particularly if you want to trade up the property ladder.
“I’ve worked out that the amount we earned on our apartment is close to my salary and this enabled us to purchase a larger apartment”
Russell Maddison, 39 years old, and his wife Hyun Kim (known as Helen), currently live in Barratt London’s Hendon Waterside development in north London.
Just three years after purchasing their one-bedroom apartment, the couple has purchased a larger two-bedroom property in the same development. Maddison explains how.
"We were quite keen on moving into a regeneration area as it helped with our budget, and we did our research, looked at the plans and considered the potential of the whole area, not just what we could see at the time.
"The decision certainly paid off, because just three years later the one-bedroom apartment we had bought for £202,000 was now worth £320,000, thanks mainly to the boost in prices caused by the regeneration of the area.
"I’ve even worked out that the amount we earned on our apartment is close to my salary and this enabled us to purchase a larger two-bedroom apartment in the same development for £465,000.
"It’s a great feeling when you see the prices going up when you have bought at an early stage. But you do have to have a careful eye, you need to be able to see ahead, look at the plans and what is there in the pipeline and try to visualise the end product."
Top 10 areas where homes have ‘earned’ more than the average salary
| Area | Average salary | Average property value | Percentage of homes that have risen in value by more than the average salary in the past year | Number of homes that have risen in value by more than the average salary in the past year |
|---|---|---|---|---|
| Hastings, East Sussex | £25,800 | £285,000 | 62% | 18,000 |
| Adur, East Sussex | £26,700 | £382,000 | 60% | 14,000 |
| Mole Valley, Surrey | £30,400 | £649,000 | 54% | 17,000 |
| Rother, East Sussex | £27,200 | £358,000 | 51% | 21,000 |
| Dorset | £28,000 | £352,000 | 47% | 71,000 |
| St Albans, Hertfordshire | £42,600 | £663,000 | 46% | 24,000 |
| Cotswold, Gloucestershire | £29,900 | £442,000 | 46% | 21,000 |
| Sevenoaks, Kent | £35,300 | £501,000 | 45% | 24,000 |
| Bromley, south east London | £41,900 | £552,000 | 45% | 51,000 |
| South Lakeland, Cumbria | £27,900 | £295,000 | 45% | 21,000 |
Research
Hastings in East Sussex has topped the ranking with the highest proportion of properties that have increased in value by more than the average pay packet during the past year at 62%, followed by Adur, also in East Sussex, at 60%.
The strong house price rises in these locations reflect the current trend among homeowners to relocate from urban to more rural areas during the pandemic.
Coastal locations were also popular, with 47% of properties in Dorset recording value increases that outstripped average salaries, while the rural locations of the Cotswolds and South Lakeland also made it into the top 10.
Another trend was strong price rises in commuter hotspots, with 54% of properties in Mole Valley, Surrey, increasing in price by more than the average salary, as did 46% of homes in St Albans and 45% in both Sevenoaks in Kent, and Bromley, south east London.
The regional picture
| Region | Average salary | Average property value | Percentage of homes that have risen in value by more than the average salary in the past year | Number of homes that have risen in value by more than the average salary in the past year |
|---|---|---|---|---|
| South east | £32,900 | £379,000 | 28% | 927,000 |
| London | £37,300 | £521,000 | 24% | 625,000 |
| South west | £29,000 | £300,000 | 29% | 620,000 |
| East of England | £31,500 | £333,000 | 23% | 514,000 |
| North west | £27,800 | £189,000 | 18% | 474,000 |
| Yorkshire & the Humber | £28,700 | £183,000 | 17% | 321,000 |
| East Midlands | £28,100 | £224,000 | 17% | 294,000 |
| West Midlands | £30,200 | £218,000 | 14% | 289,000 |
| Wales | £28,200 | £188,000 | 22% | 256,000 |
| Scotland | £34,100 | £168,000 | 9% | 165,000 |
| North east | £33,700 | £144,000 | 9% | 88,000 |
| UK | £30,500 | £265,000 | 21% | 4.6m |
Homes in the south west were most likely to see price rises that outstripped the average salary at 29%, followed by the south east at 28%.
Nearly one in four homes in London also increased in value by more than local pay during the past year, despite the fact that salaries in the capital are the highest in the UK at an average of £37,300.
Although house price growth in northern regions has been strong in percentage terms during the past year, the lower average values of properties there meant the gains have been lower in monetary terms.
Even so, nearly one in five properties in the north west saw price gains that outstripped average local pay.
Why is this happening?
Demand from potential buyers has been strong since the housing market reopened after the first national lockdown, with buyers looking for more space and a different lifestyle as they no longer had to commute to work on a daily basis.
The stamp duty holiday has also helped to fuel momentum in the housing market.
Our Head of research, said: "Hundreds of thousands of households have made the move into their new home over the last year.
"But activity has been so high, it has eroded the stock of homes for sale, which has put upward pressure on house prices, with values rising by up to 9% in some parts of the country."
1.8m homes pushed into higher stamp duty bands
Some buyers are set to fork out thousands of pounds more in stamp duty once the tax break draws to a complete close at the end of September. Could you be one of them?
Soaring house price growth has pushed more than 1.8m homes in England into higher stamp duty bands.
House prices have jumped by more than £10,000 during the past year as the scramble for homes continues.
And this house price growth is having a knock-on effect on stamp duty bills because the tax is based on a property’s price. It is charged on a tiered basis so buyers only pay the higher rates on the slice above any threshold – the same as income tax.
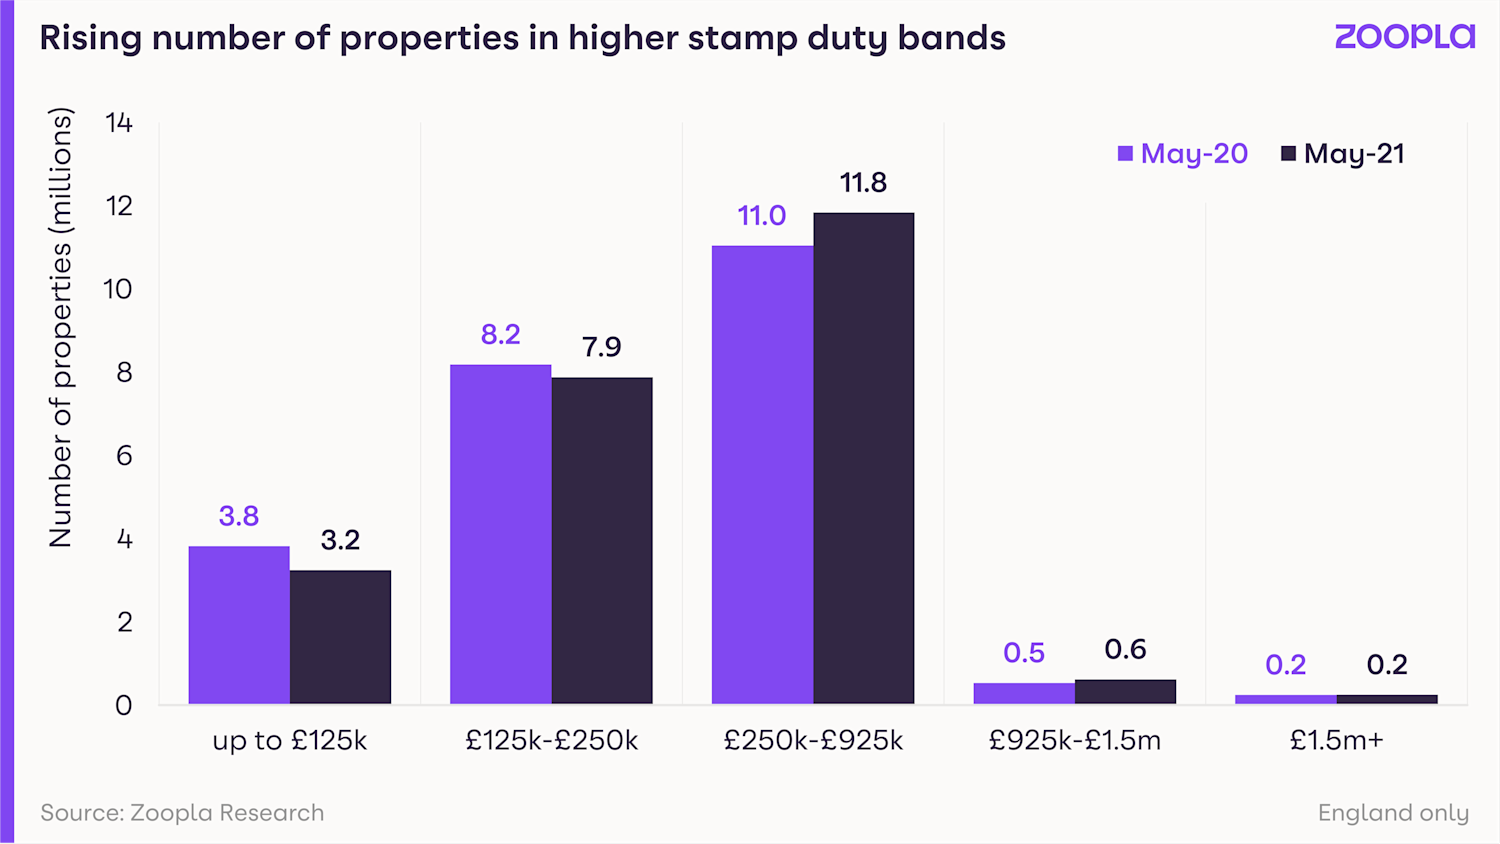
An estimated 940,000 properties have moved into the 5% stamp duty band, while 130,000 have moved into the 10% one.
At the same time, the number of homes in the lower stamp duty bands is falling.
Find out more about how stamp duty works further down this article.
What could this mean for you?
Put simply, some buyers face a bigger stamp duty bill.
Buyers purchasing a home that has moved into the 5% band face an additional cost of £725 on average once the tapered stamp duty holiday ends on 30 September.
Meanwhile those buying a property that has moved into the 10% band could expect to pay £6,100 more.
The situation should have less impact on first-time buyers, as they do not pay the tax on the first £300,000 of a property purchase, as long as the home they are buying does not cost more than £500,000.
But the strong house price rises seen during the past year could still make it harder for first-time buyers to get onto the property ladder, as affordability may be more stretched, and they will need a bigger deposit.
Why is this happening?
The housing market has been booming during the past year due to a combination of the stamp duty holiday and successive lockdowns causing people to re-evaluate the type of home they want to live in.
Our latest House Price Index shows that annual house price growth was running at 4.7% in May, more than double the rate of 2.2% seen in the same month last year.
The strong price growth has added £10,246 to the value of the typical home, enough to push many properties into a higher stamp duty band.
The lowdown on stamp duty
Buyers pay stamp duty when purchasing a property in England or Northern Ireland.
Last year, the Chancellor introduced a stamp duty holiday on properties costing up to £500,000. Although this has now ended, the threshold at which the tax kicks in will remain at £250,001 until 30 September 2021.
After this date, no stamp duty will be charged on the first £125,000 of a purchase, with the tax charged at:
- 2% on the portion from £125,001 to £250,000
- 5% on the portion from £250,001 to £925,000
- 10% on the portion from £925,000 to £1.5m
- 12% on the portion above £1.5m
It's worth remembering that stamp duty rates in England and Northern Ireland are different for first-time buyers and people buying additional property.
Top three takeaways
- Strong house price growth has pushed more than 1.8m homes in England into a higher stamp duty bracket during the past year
- Buyers purchasing a home that has moved into the 5% band face an additional cost of £725 on average once the tapered stamp duty holiday ends on 30 September.
- Meanwhile those buying a property that has moved into the 10% band could expect to pay £6,100 more.
Stamp duty holiday extension: everything you need to know
You can still save up to £2,500 in stamp duty if you buy a home before the end of September. Our guide has all the details.
The full stamp duty holiday has now drawn to a close but there’s still a tax break available on the first £250,000 of a property purchase until the end of September.
Chancellor Rishi Sunak extended the stamp duty holiday earlier this year. It meant that buyers in England and Northern Ireland would not have to pay stamp duty on the first £500,000 of property if they complete – in other words, legally transfer ownership – before 30 June 2021.
To avoid a ‘cliff edge’ at the end of this period, the threshold at which stamp duty kicks in then dropped from £500,001 to £250,001 until 30 September 2021.
Normal stamp duty rates will apply from 1 October 2021.
It’s worth remembering that there’s stamp duty relief available for first-time buyers beyond the current stamp duty holiday.
So is there still time to take advantage of the stamp duty holiday?
Yes, there’s still a window of opportunity to secure a stamp duty saving. But if you're looking to complete on your property purchase by the end of September, when the tax break is wound down completely, you'll need to have your ducks in a row well beforehand.
In a normal year, it would take on average three months from a sale being agreed to completion. But given the uptick in activity over the past year, the average time it takes for a sale to cross the line is now four months.
There's a number of ways to boost your chances of buying in time, from staying in close contact with your conveyancer, to buying a property via an auctioneer.
As the full stamp duty holiday on the first £500,000 of a property’s purchase price drew to a close at the end of June, We calculated that over 50,000 buyers in England could have been at risk of missing out on the maximum savings due to extreme pressure on and delays to the transaction pipeline.
Head of research, explained: "The busy market is being driven by a once-in-a-generation re-assessment of home as a result of the pandemic.
"This has led hundreds of thousands of households to reflect on how and where they want to live – and they are making a move as a result, with family houses most in demand.
"This trend has been certainly boosted by the stamp duty savings on offer due to the stamp duty holiday, but levels of sales activity in recent months have remained high, with many of these buyers now only expecting the lower, tapered, stamp duty exemption of up to £2,500 because of the longer timeframe to complete a sale."
The Chancellor originally announced the stamp duty holiday in July 2020 to help kickstart the housing market in England and Northern Ireland following the first national lockdown.
The tax break, combined with many people carrying out a ‘once-in-a-lifetime’ re-assessment of their housing needs in the face of the pandemic, triggered a mini home buying boom.
But the steep spike in housing transactions led to a congested sales pipeline and the home buying process taking longer than usual.
We estimated that around 70,000 people who agreed sales in 2020 were in danger of missing the 31 March deadline.
And a petition calling for the stamp duty holiday to be extended received more than 100,000 signatures, triggering a debate to be held in Parliament in February.
What are the stamp duty rates from 1 October 2021?
The former stamp duty rules will apply from 1 October 2021. This means buyers can be charged between 2% and 12% tax (or up to 17% if they are a foreign investor) on their property purchase, depending on the value of the home they are buying and if they own more than one property.
Stamp duty is calculated as a percentage of the property you are buying. It applies to freehold and leasehold properties, whether you’re buying outright or with a mortgage.
For existing homeowners, the rates are:
- 0% up to £125,000
- 2% on £125,001 - £250,000
- 5% on £250,001 - £925,000
- 10% on £925,001 - £1.5m
- 12% on any value above £1.5m
For example, if you buy a flat for £275,000, the stamp duty you owe would be:
- 0% on the first £125,000 = £0
- 2% on the next £125,000 = £2,500
- 5% on the final £25,000 = £1,250
Total stamp duty = £3,750
Read our guide to find out more about stamp duty and how it's calculated.
Landlords and second-home owners
For owners of more than one property, a surcharge of 3% on top of the standard stamp duty rates apply.
However, if you sell a home within three years of purchasing a second property, you can apply for a refund of that 3%.
It is also possible under some circumstances to claim multiple dwellings relief.
Dig into the detail in our Q&A on the 3% surcharge.
Non-UK residents
There’s been an additional 2% stamp duty levy on non-UK residents who buy property in England and Northern Ireland since April 2021.
It means that international buyers of second homes could pay up to 17% tax on expensive properties.
The 2% is on top of standard rates and in addition to the 3% surcharge for any investors who own property elsewhere.
First-time buyers
First-time buyers are exempt from paying regular stamp duty on properties costing up to £300,000 and pay 5% on the value of a property between £300,000 and £500,000.
A first-time buyer will pay:
- 0% on the first £300,000
- 5% on the remainder up to £500,000
So a first-time buyer purchasing a £275,000 flat would pay no stamp duty.
For a house costing £475,000, a first-time buyer would pay:
- 0% on the first £300,000 = £0
- 5% on the final £175,000 = £8,750
Total stamp duty = £8,750
However, if the purchase price is more than £500,000, first-time buyers cannot claim the relief and must pay the standard rates.
For example, a property purchased at £700,000 would result in a stamp duty bill totalling £25,000 even for a first-time buyer.
Stamp duty relief was introduced in November 2017 to help people step onto the property ladder.
Our guide on the first-time buyer exemption has more detail.
When do you pay stamp duty?
You must pay stamp duty within 14 days of completing your property purchase. Your solicitor or conveyancer will usually file this return and transfer the money on your behalf.
What other government support is available?
The government has a number of schemes available to help buyers. They include:
- First Homes, which offers local first-time buyers and key workers a 30% to 50% discount on the purchase of their first home
- Mortgage guarantee, under which buyers can take out a 95% mortgage, with the government acting as guarantor
- Help to Buy, which offers an equity loan to buyers with a 5% deposit
- Shared Ownership, a part-buy, part-rent scheme.
It's also a good idea to check out the initiatives and allowances you could benefit from this tax year.
What about stamp duty in Scotland and Wales?
Housing is a devolved issue in Britain so stamp duty only applies in England and Northern Ireland.
Scotland and Wales have equivalent taxes. Similar breaks were introduced but have now ended.
Scotland
In April 2015, stamp duty was replaced by Land and Buildings Transaction Tax (LBTT).
In Scotland, the LBTT rates are:
- 0% up to £145,000
- 2% on £145,001-£250,000
- 5% on £250,001-£325,000
- 10% on £325,001-£750,000
- 12% on any value above £750,000
First-time buyers pay no LBTT up to £175,000.
Wales
Property owners in Wales have paid Land Transaction Tax (LTT) since April 2018.
LTT rates are:
- 0% up to £180,000
- 3.5% on £180,001-£250,000
- 5% on £250,001-£400,000
- 7.5% on £400,001-£750,000
- 10% on £750,001-£1.5m
- 12% on any value above £1.5m
The Welsh government introduced an additional charge for second-home owners.
Second home-owners now pay a 4% levy when they buy homes up to £180,000, rising to 16% for homes worth £1.6m or above.
