What the new government’s housing priorities should be
Our Director of Research, Richard Donnell, reveals what the new government needs focus on when it comes to housing.
Current housing conditions
The sales market has been more resilient in the face of higher borrowing costs than many expected - but the adjustment is still ongoing.
Historically, moving from 1% to 5%+ mortgage rates would have led to a double digit drop in house prices.
Mortgage regulations introduced by the Bank of England in 2015 - designed to stop a debt-fuelled house price bubble driven by ultra low rates - limited the over-valuation of house prices and this is why we have had modest price falls over the last 18 months.
Someone buying a home in 2021 paying a 1.5% mortgage would have to prove to their bank they could afford a 6.5-7% mortgage ‘stress’ rate to get the loan approved.
Banks were also limited to how much business they could do at high loan to income ratios and have had to hold more capital for risker high loan to value lending.
These regulations have capped buying power and constrained house prices especially in higher value housing markets.
The impact is greatest for first-time buyers (FTBs), who account for over a third of all housing sales and higher for most mainstream builders.
In 2023, the average FTB buying in London had a £90k income and a £150k deposit, while across the rest of southern England FTBs needed a £60-£65k income and £100k deposit.
Across the rest of the UK, FTBs need to earn a £50k income and a £35k deposit.
This big north-south divide in affordability matters and impacts what we need to build locally in order to support sales rates and address housing needs.
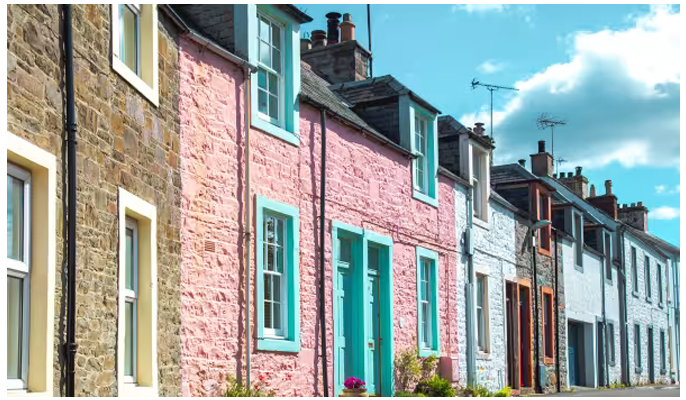
In unaffordable areas, there is a need to build a wider price range of freehold and leasehold homes.
The national government needs to empower local government and city regions to get into the detail of what is needed and works for their needs - this can’t be set from the centre.
Rented housing markets face large supply/demand mismatch
The private rented sector stopped growing in 2016 after doubling in size from 2000, while the social housing sector has seen static headline supply for over 20 years.
There is a modest shake out in the rental market as private landlords, who are no longer seeing renting out homes as a viable business, exit the market.
It’s not an exodus - but the business model has shifted from landlords making money on their properties over many years, to one of focused on monthly cashflow.
The sector is becoming more professionalised and 50% of rented homes are now owned by 20% of private landlords.
While there is more corporate investment, private landlords still hold the key to the overall balance of supply/demand for the next decade or more.
The new government should ensure long term private landlords, who want to deliver decent homes, are encouraged to remain.
Long term, cashflow-focused landlords have nothing to fear from proposed rental reforms.
While supply has been static, the demand side has been booming - a strong labour market, record high immigration from people looking to work and study, has led to an unaffordability of homeownership.
Pre-pandemic, we saw 5-6 people chasing every rented home on Zoopla, it peaked at over 30 in 2021 and is now down to 15 people per rental.
Rents have been outpacing earnings growth for almost 3 years - private rents are 31% higher compared to earnings, which have risen 24%, while the Consumer Price Index has risen CPI 20% - and housing benefit has only risen 15%.
Rental inflation is slowing due to growing affordability constraints rather than more supply. Rents have over-shot in some cities and there have been some modest falls. Across the UK overall, rents won't fall but business plans for rental investments need to have realistic assumptions on how much rents will rise over the next few years.
I should point out renters on low incomes are particularly impacted by strong competition and little-to-no growth in social housing.
Building more affordable rented homes and getting more financial capacity and certainty into the affordable sector is a key pillar to getting more homes built overall, it’s an area where demand is arguably greatest.
Outlook for the market
Rents for new lets will rise by 4-5% this year and affordability constraints among renters will drag on rental inflation in expensive rented markets
We’re now entering an era of much lower nominal house price inflation. House prices are up 1-2% this year and are currently 8% ahead of where they should be in London and southern England.
We expect house prices to rise 2-3% over the next 2-3 years, which is enough to support the development of new homes by builders.
On average, 1.2m homes are sold every year, this year, we expect 1.1m homes to sell, up 10% from 2023.
What a new government’s housing priorities should be
-
Introduce rental reforms but not rent controls, and reset Housing Benefit levels so that they are in line with the current market
-
Build more homes but ‘set the big picture’ nationally and enable a framework for success locally
-
Reform the planning system, with land assessments and housing targets
-
Greater investment in local authority planning teams
-
Clarity for affordable housing providers to encourage investment
Demand for homes exists, but there’s a huge variation in what is needed across various price points and tenures across the UK.
We need to ensure there is the investment capacity to support more supply of homes at scale and give new homes developers the confidence that there are buyers out there.
Key takeaways
- More new homes across a range of price points
- Housing Benefit to rise in line with inflation and wages growth
- Greater investment in local authority planning departments
House prices set to rise 1.5% by end of 2024
The average house price today is the same as it was in May 2023: £264,900. But some areas are rising while others are falling. Find out what’s happening near you.
UK house prices starting to rise across the UK
Our House Price Index, which measures the rise and fall of house prices across the UK, reveals house prices have risen across all areas of the UK over last quarter.
House price inflation is no longer in negative territory and stands at 0% year-on-year, meaning the average house price is now £264,900, the same as it was a year ago.
Despite this, southern England does remain in negative territory in terms of annual inflation, although that gap is now lessening, while prices have risen elsewhere in the UK.
Sales market momentum is continuing throughout the build-up to the election, with demand for homes up 6% on this time last year.
The number of sales agreed is also up 8%, and we believe that 75% of the 1.1m sales projected for this year have already completed or are on their way through the pipeline.
We calculate that UK house prices are currently 8% ‘over-valued’, a hangover from the sharp price rises that took place during the pandemic, and we expect this to have rectified by the end of the year.
Overall, UK house prices are on track to rise 1.5% over the whole of 2024, a sign that the housing market is remaining resilient.
Our Executive Director of Research, Richard Donnell, says: “The housing market continues to adjust to higher borrowing costs and the summer slowdown is now arriving, tempering activity. The timing of the first cut in the base rate is key and will give a boost to market sentiment and sales activity.”
The average prices for different property types across the UK
The average price of UK properties is holding steady, with a minor increase of £110 month–on-month and an annual price change of 0% year-on-year.
Meanwhile, if you’re a buyer, this could be the time to look into detached propertes, as they are now nearly £2,300 cheaper than they were this time last year.
Equally, flats and maisonettes are down in price, and are now £2,000 cheaper on average than this time last year.
|
Property type |
Average house prices in March |
Average house prices in April |
Average house prices in May |
£ annual price change |
% annual price change |
|
All property |
£264,300 |
£264,700 |
£264,900 |
£110 |
0.00% |
|
Detached |
£445,800 |
£446,400 |
£447,500 |
-£2,290 |
-0.50% |
|
Flats/Maisonettes |
£190,400 |
£190,700 |
£191,100 |
-£2,030 |
-1.10% |
|
Semi-detached |
£269,100 |
£269,300 |
£270,100 |
£1,950 |
0.70% |
|
Terraces |
£232,700 |
£232,700 |
£233,600 |
£1,910 |
0.80% |
Where are UK house prices rising and falling in June 2024?

Regions where house prices are rising
Homes in Northern Ireland have seen the biggest rise in prices over the last 12 months, up 3.3%.
They’re hotly followed by homes in the North West (1.5%), the North East (1.4%), Scotland (+1.3%), Wales (+1%) and the West Midlands (+0.5%).
The lower property prices in these regions means there’s less of an impact here from higher mortgage interest rates, supporting demand and consequently, house price rises.
Down in Southern England, the picture is less rosy, with the East of England (-1.4%) leading the way in terms of house price falls.
It’s followed by by the South East (-1%), South West (-0.9) and London (-0.4%).
The East Midlands is also experiencing slight falls of 0.4%.
However, prices in these regions are starting to stabilise, and with prices starting to rise, the falls are now narrowing year-on-year.
|
Region |
£ annual price change |
% annual price change |
Average house price |
|
Northern Ireland |
£5,440 |
+3.3% |
£170,400 |
|
North West |
£2,810 |
+1.5% |
£195,600 |
|
Wales |
£2,060 |
+1% |
£204,000 |
|
Scotland |
£2,050 |
+1.3% |
£163,200 |
|
North East |
£1,980 |
+1.4% |
£142,500 |
|
Yorkshire |
£1,300 |
+0.7% |
£186,600 |
|
West Midlands |
£1,150 |
+0.5% |
£230,200 |
|
East Midlands |
-£810 |
-0.4% |
£228,600 |
|
London |
-£2,250 |
-0.4% |
£535,700 |
|
South West |
-£2,790 |
-0.9% |
£312,900 |
|
South East |
-£4,020 |
-1% |
£385,600 |
|
East of England |
-£4,670 |
-1.4% |
£335,800 |
|
UK |
£110 |
0% |
£264,900 |
Top 10 cities where house prices are rising
Belfast is leading the way in terms of rising house prices, with homes here up 3.4% in the past year, a rise of £5,680, taking the average house price to £173,900.
It’s hotly followed by Rochdale (+2.7%), where prices have risen by an average of £4,460, taking the average house price to £170,100, and Bolton, where homes have gone up 2.3% (£3,790) to hit an average of £171,900.
|
City |
£ annual price change |
% annual price change |
Average house price |
|
Belfast |
£5,680 |
+3.4% |
£173,900 |
|
Rochdale |
£4,460 |
+2.7% |
£170,100 |
|
Bolton |
£3,790 |
+2.3% |
£171,900 |
|
Huddersfield |
£3,860 |
+2.2% |
£178,700 |
|
Burnley |
£2,770 |
+2.2% |
£128,600 |
|
Barnsley |
£3,130 |
+2% |
£160,100 |
|
Wigan |
£3,210 |
+1.9% |
£170,500 |
|
Bradford |
£2,680 |
+1.7% |
£157,600 |
|
Manchester |
£3,590 |
+1.6% |
£224,900 |
|
Blackburn |
£2,190 |
+1.6% |
£175,900 |
10 cities where house prices are falling
Cities in the south of England are faring less well, with Ipswich leading the way in terms of house price falls. Prices here are down 3% year-on-year (an average of -£6,520), taking the average house price to £212,100.
In the coastal town of Hastings, house prices are down 2.8% since last May, a fall of £7,890, taking average house prices to £271,400, while in historic Norwich, homes have dropped 2.1% (£5,550), taking the average house price here to £260,900.
|
City |
£ annual price change |
% annual price change |
Average house price |
|
Ipswich |
-£6,520 |
-3% |
£212,100 |
|
Hastings |
-£7,890 |
-2.8% |
£271,400 |
|
Norwich |
-£5,550 |
-2.1% |
£260,900 |
|
Medway |
-£4,910 |
-1.7% |
£285,800 |
|
Northampton |
-£3,880 |
-1.6% |
£234,800 |
|
Brighton |
-£6,320 |
-1.6% |
£398,800 |
|
Bournemouth |
-£5,140 |
-1.5% |
£331,700 |
|
Milton Keynes |
-£4,270 |
-1.4% |
£307,900 |
|
Aberdeen |
-£1,850 |
-1.3% |
£137,400 |
|
Portsmouth |
-£3,520 |
-1.2% |
£279,100 |
Top 10 local authorities where house prices are rising
The north, where homes are traditionally less expensive than in the south, is seeing the greatest price growth in terms of housing.
Sunderland is leading the way, with prices up 5.2% year-on-year, a rise of £5,990, taking the average house price to £121,900. It’s followed by Dumfries & Galloway in Scotland (up 3%, or £4,830), where the average house price is now £148,000, and Lanarkshire.
Homes in North Lanarkshire are up just over £3,000, averaging out at £123,500, while homes in South Lanarkshire are up £3,700, averaging out at £146,100.
|
Local authority |
£ annual price change |
% annual price change |
Average house price |
|
Sunderland |
£5,990 |
5.2% |
£121,900 |
|
Dumfries & Galloway |
£4,830 |
3% |
£148,000 |
|
North Lanarkshire |
£3,110 |
2.6% |
£123,500 |
|
South Lanarkshire |
£3,700 |
2.6% |
£147,100 |
|
Powys |
£5,430 |
2.3% |
£236,600 |
|
Shropshire |
£6,280 |
2.3% |
£277,900 |
|
Sir Ceredigion |
£5,330 |
2.3% |
£238,000 |
|
Scottish Borders |
£4,030 |
2.2% |
£183,800 |
|
Rochdale |
£3,710 |
2.2% |
£170,200 |
|
Oldham |
£3,850 |
2.2% |
£177,400 |
Local authorities where house prices are falling
Down in the more expensive south, prices are continuing to fall, after climbing rapidly during the pandemic years.
Leafy Kent and its seaside towns are taking a hit, with historic Canterbury leading the falls, where house prices have fallen -4.1% (£14,430) to an average of £339,300.
Canterbury’s followed by the coastal areas of Thanet (down 3.9% or £11,630 to £286,200) and Dover (down 3.8% or £11,630 to £293,400).
Prices in Essex are also down, with Tendring, Braintree and Colchester also experiencing falls of around 3%, or £8-10,000.
|
Local authority |
£ annual price change |
% annual price change |
Average house price |
|
Canterbury |
£14,430 |
-4.1% |
£339,300 |
|
Thanet |
£11,630 |
-3.9% |
£286,200 |
|
Dover |
£11,640 |
-3.8% |
£293,400 |
|
Tendring |
£8,010 |
-3% |
£258,500 |
|
Braintree |
£10,270 |
-2.9% |
£341,300 |
|
Colchester |
£8,830 |
-2.8% |
£301,800 |
|
Wealdon |
£11,730 |
-2.6% |
£435,200 |
|
Rother |
£10,010 |
-2.6% |
£375,400 |
|
Tonbridge Wells |
£11,720 |
-2.5% |
£462,400 |
|
West Somerset |
£7,640 |
-2.4% |
£304,800 |
Momentum continues in the sales market
Momentum in the sales market has continued over June, albeit at a slightly slower pace than the previous 2-3 months as the market is enters the quieter summer period.
And while house price inflation remains negative in the south, improving sales volumes over the first half of the year has led to a firming up of prices.
“All regions and countries of the UK have registered an increase in house prices on a month-on-month basis since January,” says Donnell. “But price rises are unlikely to pick up speed in the coming months.”
That said, on average, they are on track to be 1.5% higher at the end of this year.
75% of this years’ sales are completed or in progress
Our data shows the market is still on track for 1.1m sales this year, and three quarters of these sales have either been completed, or are working their way towards completion.
This figure is 10% higher than the number of sales that took place in 2023 but still below the 20-year average.
“It is positive that sales are rising despite higher borrowing costs,” says Donnell. “It shows more realism on the part of sellers and renewed, cautious confidence amongst buyers.”
How higher mortgage rates have affected house prices
The housing market has been very resilient over the last year given the rise in mortgage rates. These averaged below 2% in late 2021 and stand at 4.7% today, spiking well over 5% in October 2022 and again over the summer of 2023.
“Higher borrowing costs have reduced the buying power of new buyers. But rather than sizable price falls, the main impact has been a sharp decline in the number of sales, which were 23% lower over 2023,” says Donnell.
“House prices haven’t fallen as there have been few forced sellers. And unemployment has stayed low by historic standards, meaning there are a relatively small number of people struggling to pay their mortgage and falling into arrears, despite wider cost of living pressures.
“We expect house price inflation to remain muted, likely to rise more slowly than household incomes over the next 1-2 years.”
Interest rates hold the key
Looking ahead, the near-term outlook for the sales market really depends on the outlook for mortgage rates, which are dependent on interest rates.
“Any reductions in the base rate over the summer and into the autumn will deliver a boost to market sentiment and sales activity, even though the impact on fixed rate mortgages will likely be more muted,” says Donnell.
“Based on city forecasts for base rates, we expect mortgage rates to remain in the 4-4.5% range going into 2025. This is sufficient to support sales volumes and low, single digit levels of house price inflation.”
Meanwhile, house prices in the south of England are expected to continue to under-perform compared with the UK average, as prices realign with incomes.
“Real income growth will be the key to supporting sales and demand into 2025,” says Donnell.
Key takeaways
- House prices are now at 0% inflation compared to May 2023
- However, the average UK house price is set to rise by 1.5% by the end of the year
- We believe house prices are currently 8% ‘over-inflated’ to where they need to be, but this will correct itself by the end of the year
- 75% of 2024 house sales have already completed or are in the pipeline
Bank Rate holds at 5.25%, so when will rates drop?
The Bank Rate holds at 5.25%, despite inflation hitting its 2% target for the first time in 3 years.
Bank rate holds at 5.25%
The Bank of England has kept the Bank Rate at 5.25% for the seventh time in a row.
The Bank has held rates at 5.25% in an effort to combat inflation, leading to higher mortgage repayments but also higher savings rates.
The Bank Rate, sometimes known as the 'base rate’ or ‘interest rates’, affects the rates that lenders charge their borrowers.
Inflation hits 2% target for first time in three years
Inflation slowed to 2% in the 12 months to May, hitting the Bank of England’s target for the first time in almost three years, according to data released by the Office for National Statistics on 19 June.
With rising prices coming back under control, all eyes had been on the Bank to see if the news might mean a cut in the interest rate, which has been frozen at a 16-year high of 5.25% since August 2023.
However, uncertainty over whether cuts would come had led to a rise in mortgage rates in recent months, with average rates on two- and five-year fixed rate deals creeping up since February, according to Moneyfacts.
The average two-year fixed rate now stands at 5.93%, while the average five-year fixed rate stands at 5.50%.
John Fraser-Tucker, Head of Mortgages at online mortgage broker Mojo Mortgages said: “Naturally, the BoE tends to stay neutral during a General Election, so making a rate change weeks before voters head to the polls could be seen as influencing voters.
“Moreover, the housing policies of the elected government are likely to impact the outlook for the base rate going forward.
“Labour’s manifesto seems to focus more so on first-time buyers as they’ve stated that they’ll make the existing mortgage guarantee scheme permanent under the name 'Freedom to Buy'. Comparatively, the Conservatives have focused on policies that they believe will bring down mortgage costs.
“Given the contrasting focuses, it makes sense for the BoE to wait and see which government is elected before lowering the base rate, otherwise it could add more uncertainty to the mortgage market right now.”
Choice of mortgages available increases to highest level since 2008
Meanwhile in good news for borrowers, the choice of mortgages available has increased, with borrowers now having 6,629 mortgage deals to choose from, the largest number available since February 2008, according to Moneyfacts.
However, buyers will need to act quickly to secure the best deals, as the average shelf life of a product has reduced from 28 days at the start of May to just 15 in June.
What does the news mean for existing borrowers?
Borrowers on variable or tracker mortgages will be relieved that their rate is unlikely to go up. Though they’ll be disappointed the Bank Rate wasn’t cut.
According to the HomeOwners Alliance, the average standard variable rate (SVR) now stands at 8.18%, down from 8.19% last November. The rate has stayed at this level since the start of April.
Meanwhile, borrowers locked into fixed-rate mortgages will not be impacted - yet. But borrowers who are due to come off fixed-rate deals and remortgage soon are likely to see their mortgage repayments jump, squeezing household budgets further.
Annual mortgage repayments for the average buyer are now a staggering 61% higher than they were three years ago, before mortgage rates started climbing.
It means that in pure monetary terms, they have soared from £7,100 to £11,400. Two thirds of that hike is fuelled by higher mortgage rates, while one third is due to higher house prices.
First-time buyers are finding it tricky to afford mortgage repayments in the first place. Because of recent interest rate rises, mortgage affordability is now the biggest challenge for first-time buyers, according to the Building Societies Association (BSA).
What is the forecast for interest rates?
The Bank is generally expected to cut interest rates this year (assuming there are no surprises in store). But opinions on when exactly this could happen, and by how much, naturally vary.
Some economists believe the rate will be cut in August, while others are suggesting it may be as late as September.
As a general rule: if interest rates fall, the mortgage rate forecast would be for mortgage rates to fall too. But time will tell if this happens.
Our Executive Director of Research, Richard Donnell, believes that even if inflation and interest rates edge down, mortgage rates are unlikely to drop much further this year.
Donnell explains: “Lower interest rates would likely result in further modest declines in mortgage rates but how far depends on how low money markets see base rates falling.
“Economists currently expect base rates to fall to 3.5% by the end of 2025, which would imply mortgage rates remaining in and around the 4%+ range.”
Key takeaways
- The Bank of England has held the Base Rate at 5.25% for the 7th time in a row
- Many had been hoping for a drop in the Base Rate after inflation hit its 2% target for the first time in 3 years in May
- The news will be disappointing for mortgage holders, who have been longing for mortgage rates to go down since the bank rate hit its highest level in 16 years in August 2023