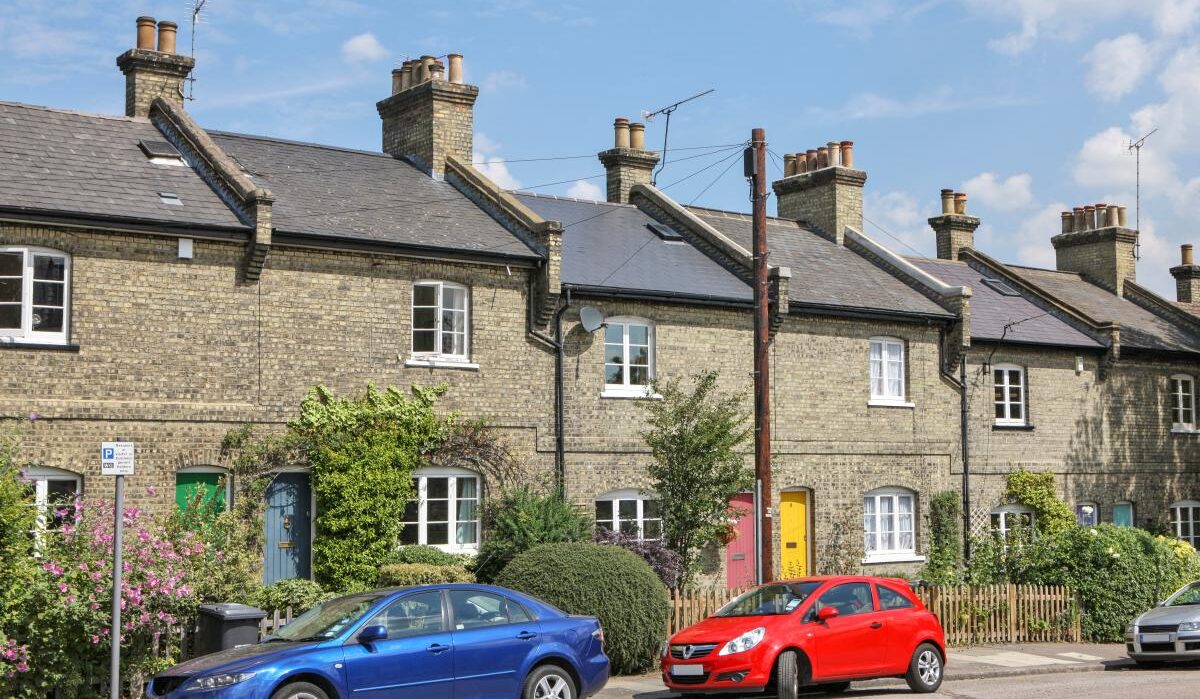
Home buyers and sellers are back in market
Demand for homes up 11% as buyers and sellers return to market in growing numbers, boosting sales. Our Executive Director of Research, Richard Donnell, has the latest.
Buyer demand now 11% higher than last year
The first weeks of January got off to a strong start with activity spurred on by falling mortgage rates and pent-up demand from the second half of 2023.
Our latest data shows this momentum has been carried into the first half of February.
At a headline level, buyer demand is running 11% higher than this time last year. Buyer numbers are up across all parts of the UK but London is firmly out in front, followed by the North East and North West regions.
London’s housing market has lagged behind the rest of the UK for seven years since 2016 with low levels of house price growth due to stretched housing affordability.
The average value of a flat is just 13% higher than in 2016, compared to the UK average house price being 33% higher and up to 50% higher in Wales.
Better value for money is improving the prospects for London but it remains an expensive housing market.
A healthier market with more sales agreed
One of the best ways to assess the overall health of the housing market is to look at the trends in the number of sales being agreed.
If buyers and sellers are agreeing more sales then that shows a healthier market, with people able to fulfil their home moving ambitions.
The fact we have almost a fifth more homes for sale than a year ago is helping, providing buyers with more choice and boosting the chances of sales being agreed.
Our latest data shows sales agreed are up across all regions and countries of the UK and more than 10% higher in six regions led by London, the South East and Yorkshire and Humber.

Increasing demand and sales bring more sellers into the market
Improving market confidence is bringing more sellers into the market. We have seen an increase in the number of new homes being listed for sale.
The flow of new homes for sale is 10% higher than a year ago and the highest it’s been since 2020. New sellers are listing their homes at the fastest pace in the East of England, the South West and North East.
33 days to agree the sale of a home
In 2023 the average sale took 34 days - from the property first being launched to the market to a sale being agreed, subject to contract.
This is 2 weeks longer than the hotter pandemic fuelled market of 2022 - when homes went under offer in 20 days.
Pitching the asking price at the right level is key to attracting demand and getting a sale agreed. This can be harder for unique or unusual homes. Sellers need to speak to local agents to understand the market and the demand for their type of home.

The longest sales periods in 2023 were up to 40 days in London and the South East with the fastest sales periods in Scotland (20 days) and the North East (30 days).
This difference primarily reflects housing affordability and the impact of higher mortgage rates on buying power in markets with high house prices. It’s why falling mortgage rates are boosting activity more in southern England, especially London.
It’s important to note that once a sales has been agreed, it can take another 3-6 months for the legal and mortgage process to get to an exchange of contracts - and then legal completion, when you can get the keys to your new home.
A need for realism on pricing remains
We expect rising activity to continue over the coming months. The market is better balanced between sellers and buyers than it has been for 3 years.
Despite reports that house prices are rising once again, it’s important sellers keep their feet on the ground.
The positive news is that finding a buyer is going to be easier for most sellers but more choice of homes for sale will mean greater room for negotiation.
Key takeaways
- Buyers and sellers are returning to the housing market in growing numbers, boosting sales across the UK
- London is leading the way in terms of buyer demand, followed by the North East and North West regions
- Meanwhile, the flow of new homes for sale is 10% higher than a year ago and the highest it’s been since 2020

Average rent in London: February 2024
The average rent in London is now £2,119 per month after +6.4% growth in the last year. The cheapest average rent is in Bexley (£1,520) and the highest average rent is in Kensington and Chelsea (£3,460) although rental increases are slowing in the most expensive parts of the city.
London is by far the most expensive place to rent a home in the UK with an average rent of £2,119 for new lets. Average rents in London are almost double the UK average of £1,220.
However, rental inflation in London has slowed in the last 12 months, now at +6.4% versus +16.1% a year ago. This is currently lower than UK-wide growth of +8.3% over the last year.
Average rental prices in London
| Average monthly rent in London (December 2023) | Average monthly rent in London (December 2022) | % change in the last 12 months | £ change in the last 12 months |
|---|---|---|---|
| £2,119 | £1,989 | +6.4% | £130 |
Zoopla Rental Index. Data to December 2023, published February 2024

Average rent by local authority in London
The table sets out the average rent for every local authority in London, starting with the cheapest. It also shows how much rents for new lets have increased in the last 12 months in each location.
| London borough | Average monthly rent (December 2023) | % change in the last 12 months | £ change in the last 12 months |
|---|---|---|---|
| Bexley | £1,520 | +11.7% | +£160 |
| Croydon | £1,540 | +9.2% | +£130 |
| Sutton | £1,544 | +11.9% | +£160 |
| Havering | £1,583 | +13.6% | +£190 |
| Bromley | £1,609 | +9.6% | +£140 |
| Enfield | £1,649 | +11.3% | +£170 |
| Hillingdon | £1,656 | +11.9% | +£180 |
| Barking and Dagenham | £1,657 | +13.3% | +£190 |
| Redbridge | £1,720 | +13.0% | +£200 |
| Lewisham | £1,740 | +8.4% | +£130 |
| Harrow | £1,774 | +10.3% | +£170 |
| Waltham Forest | £1,782 | +11.4% | +£180 |
| Kingston upon Thames | £1,801 | +10.1% | +£160 |
| Hounslow | £1,844 | +9.2% | +£160 |
| Greenwich | £1,865 | +9.1% | +£160 |
| Barnet | £1,890 | +9.3% | +£160 |
| Haringey | £1,917 | +9.9% | +£170 |
| Brent | £1,949 | +7.4% | +£130 |
| Ealing | £1,956 | +9.0% | +£160 |
| Merton | £1,976 | +7.7% | +£140 |
| Newham | £1,983 | +7.2% | +£130 |
| Richmond upon Thames | £2,095 | +7.2% | +£140 |
| Lambeth | £2,181 | +5.2% | +£110 |
| Southwark | £2,217 | +5.7% | +£120 |
| Hackney | £2,330 | +6.1% | +£130 |
| Tower Hamlets | £2,331 | +5.% | +£110 |
| Islington | £2,380 | +6.4% | +£140 |
| Wandsworth | £2,383 | +6.7% | +£150 |
| Hammersmith and Fulham | £2,616 | +7.3% | +£180 |
| City of London | £2,629 | +3.4% | +£90 |
| Camden | £2,669 | +6.2% | +£160 |
| City of Westminster | £3,153 | +4.8% | +£140 |
| Kensington and Chelsea | £3,460 | +5.1% | +£170 |
Zoopla Rental Index. Data to December 2023, published 2024
Rental growth has slowed the most in Inner London boroughs, which are also commonly the most expensive with average rents sitting well above £2,000 per month. For example, we were seeing rent rises of up to +20.9% in Tower Hamlets a year ago where the average rent is £2,331, but these increases have now steadied to +5.0%.
However, the experience of renters in Outer London is a different story, with double-digit rental inflation in many areas. Rents have risen by more than +13% in the last year in more affordable eastern boroughs of Havering, Redbridge and Barking and Dagenham.
These reductions suggest landlords are becoming more realistic in pricing their rentals and may be taking cost-of-living struggles into consideration when setting new rates, which tend to be exacerbated for those in the rental market.

What’s next for the London rental market in 2024?
We expect the growth of London rents to slow to around +2% on average in 2024.
It’ll be a reprieve for London renters as they already face the highest rents and lowest affordability of anywhere in the country. The average renting household in London (1.25 people) already spends 40.4% of their earnings on rent compared to a UK average of 28.4%.
Demand from London renters will continue to drop as many cannot afford further rent rises amidst other affordability pressures.
London renters will continue to look for lower rental prices in the outer boroughs and nearby commuter towns, which will keep average rents rising in these places.
Key takeaways
- London’s average rent is currently £2,119 after +6.4% growth in the last year
- This annual increase is lower than the UK as a whole as London rents have started to reach an affordability ceiling
- The borough of Bexley has the cheapest average rent in London at £1,520 but rents are still rising quickly in these comparatively cheap spots on the outskirts
- Rents are much higher in Inner London boroughs like Kensington and Chelsea, the City of Westminster and Camden but annual increases are lower at around +5%

Average rent in the UK: February 2024
The average rent in the UK is now £1,220 per month after 8.3% growth in the last year. The highest average rent in the UK is in London (£2,119) while the North East has the lowest monthly rent (£695).
The average UK rent for new lets has now reached £1,220, an +8.3% rise in the average UK rent over the last year.
This equates to UK renters paying an extra £1,100 per year (or £90 per month) compared to a year ago.
However, this rate of inflation is lower than we’ve seen at any time during the last two years. In 2023 alone, rental growth dropped from +11.4% to +8.2%.
Average rental prices in the UK: last 3 months
| December 2023 | November 2023 | October 2023 | |
|---|---|---|---|
| Average monthly rent in the UK | £1,220 | £1,200 | £1,166 |
data to December 2023, published in February 2024
Average rent by region
Average rents vary across the country, from a high of £2,119 per month in London to £695 per month in the North East.
Rent growth has now slowed in all regions except the North East. Average rents for new lets in the region increased by +9.3% in the last year, compared to +8.1% the year before.
The table shows current average rents for new lets across UK regions and how much they have changed in the last year.
| Region | Average monthly rent | Change on a year ago (%) | Change on a year ago (£) |
|---|---|---|---|
| London | £2,119 | +6.4% | +£130 |
| South East | £1,325 | +9.3% | +£110 |
| East of England | £1,162 | +9.3% | +£100 |
| South West | £1,076 | +8.1% | +£80 |
| West Midlands | £905 | +8.7% | +£70 |
| Wales | £880 | +9.4% | +£80 |
| East Midlands | £860 | +9.2% | +£70 |
| North West | £847 | +10.2% | +£80 |
| Yorkshire and the Humber | £799 | +7.7% | +£60 |
| Scotland | £791 | +11.6% | +£80 |
| Northern Ireland | £733 | +3.7% | +£30 |
| North East | £695 | +9.3% | +£60 |
December 2023, published in February 2024
Rental inflation in Scotland boosted by rent controls
In September 2022, the Scottish Parliament introduced a rent cap of 3% on annual rises to existing tenancies.
While intended to reduce cost-of-living pressures for renters, it means landlords are now going higher at the start of a tenancy to cover their costs and the limited increases during the contract.
This leads to Scotland having the highest level of annual rental inflation in the UK at +11.1%. The average monthly rent in Scotland stands at £790, £82 more than a year ago.
However, this is already a slower rate of growth than the highs of +13.7% back in February 2023, but we still expect Scotland to see faster rental growth than anywhere else in the UK in 2024.
Fast-increasing rents in Glasgow (+11.4%) and Edinburgh (+12.5%) are encouraging renters to look into neighbouring areas, leading to large rent increases beyond main cities. Average rents in three local authorities adjacent to Glasgow and Edinburgh breached the £1,000 mark in 2023 (East Dunbartonshire, East Renfrewshire and East Lothian).
Rental inflation is much less dramatic in rural parts of Scotland, with Aberdeenshire, Moray and the Highlands all recording growth below +6%.
Rental inflation slows down in inner London
Rental inflation has slowed down in London and some southern cities in the last 12 months, giving some relief to renters in the expensive South of England.
The largest moderation is in London, where rental inflation has dropped from +16.1% a year ago to +6.4% today.
Rental growth has slowed the most in Inner London boroughs. A year ago, we were seeing rises of up to +20.9% in Tower Hamlets, which has now dropped to +5%.
However, the experience of renters in outer London will be different, as there is still double-digit rental inflation in many areas. Rents have risen by more than +13% in more affordable eastern boroughs of Havering, Redbridge and Barking and Dagenham.
These reductions suggest landlords are becoming more realistic in pricing their rentals and may be taking cost-of-living struggles into consideration when setting new rates, which tend to be exacerbated for those in the rental market.
What factors influence rental prices?
One of the most important factors that influences rental prices is the level of demand from renters versus supply of rental properties.
A chronic mismatch between supply and demand has been the defining feature of the UK rental market for three years. It’s the main reason rental inflation has been so sharp during that time.
Rental growth is also impacted by earnings growth - a strong jobs market and subsequent wage rises keeps demand high and means tenants can weather rent increases.
In the last year, higher mortgage rates have also impacted rents as they’ve prevented more would-be first-time buyers from owning a home and boosted demand for rental homes.
What are renters doing to minimise the impact of higher rents?
Some renters have escaped the steepest rises by staying in their existing homes.
Year-on-year rises for established tenancies rose at the slower rate of 6.2% according to the Index of Rental Prices from the Office for National Statistics.
When renters move and are faced with higher rents and a limited supply of homes on the market, they're more commonly considering renting smaller homes, moving to cheaper areas or house-sharing to reduce costs.
House-sharing reduces the cost of housing per person but it comes at the personal expense of privacy and space. Data from the Resolution Foundation found private renters have experienced a 16% reduction in floor space per person over the last 20 years.
What’s next for the rental market?
We believe that the rental market is now past peak rental growth after starting to cool in the final months of 2023.
We expect a further slowdown in rental growth in 2024 as worsening affordability keeps demand in check and supply improves slowly. There are already signs asking rents have overshot in some of the most expensive markets that are showing resistance to higher rents.
Slower increases will be welcome news to renters who have often faced steep hikes in the last two years.
Key takeaways
- The average UK rent has risen 8.3% on average in the last year, adding £1,100 to the average annual bill
- UK renters are now paying £1,220 per month on average, ranging from £695 in the North East to £2,119 in London
- Rental growth slowing to single digits is a sign we're past peak growth after nearly two years of 10%+ increases
- Scotland continues to register the highest rental growth for new lets despite rent controls
- London is seeing growth slow the most as rents hit an affordability ceiling
- We expect a further slowdown in rental growth in 2024 as worsening affordability keeps demand in check
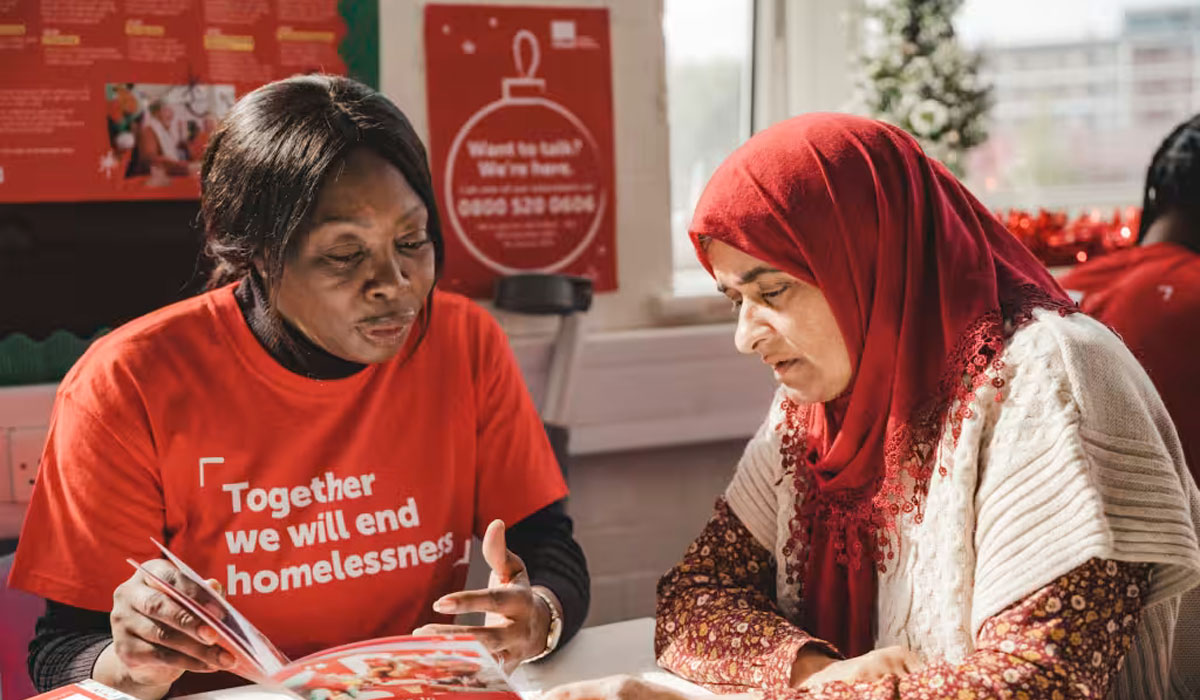
4 things you might not know about homelessness
Ruth Stone is a Strategic Communications Project Manager at Crisis and her role is all about helping people understand the realities of homelessness. Here, she shares 4 things you might not know about homelessness.
What does home mean to you?
For me, it’s a place I share with my partner and our cats. It’s a space to unwind and be myself. I’ve moved home a lot – and whenever I get to a new place, I unpack my things as quickly as possible so it feels like home. I start with the kitchen because I am never happier than when I’m cooking.
Whatever home means to you, it’s about much more than a roof over your head or somewhere to sleep. And yet sometimes we can forget this when we think about the issue of homelessness.
The views that we have about any topic – including homelessness - are formed in us over a long period of time. They come from our experience, our culture and our media. What we see and hear on the news, in film, on podcasts or just in conversation with family, friends and colleagues all shapes our thinking.
When it comes to homelessness, research has shown there is often a big gap between the realities of what it is, what causes it and how to end it - and how people think and understand the issue.
My role at Crisis is focused on helping to close this gap by working with organisations and individuals to tell a different and more helpful story about homelessness. Which is why I’m sharing four things you might not know about homelessness.
1. Homelessness can be visible or hidden
Homelessness doesn’t look one way. When we think about homelessness, we tend to go straight to the most visible form - rough sleeping. Which makes sense as this is the type of homelessness we see as we travel around our towns and cities.
But homelessness can also be less visible or hidden. For example, many people might be sleeping on a different friend’s sofa every week.
Hidden homelessness also includes unconventional accommodation. This is when people sleep in spaces that are not intended as residential accommodation, like a car, lorry or shed. Some people sleep on public transport because they have nowhere else to go.
None of us should be forced to experience any of these types of homelessness. All of us should have a safe and stable home.
2. Homelessness can be short term or long term
Hostels, shelters and refuges are forms of emergency and temporary accommodation. People may be in this type of accommodation from one night to indefinitely.
The cost of living, rising rents and a sheer lack of truly affordable homes means a record number of us are currently trapped in temporary accommodation.
When we’re forced to live in temporary accommodation that is often unsuitable, insecure and far away from our support networks, it makes it so much harder to do basic things – like register for a doctor, cook a healthy meal, travel to work or do our homework.
3. All forms of homelessness are bad for our health
Whether someone is sleeping on the streets in fear of their safety, facing the constant stress of living with their family in a cramped hotel room or having to move to another sofa week after week, homelessness takes a huge toll on people’s mental health.
Home should be a space where we can thrive. Where we can relax and spend time with our loved ones. It should be a place where we can rest and recover if we are ill.
It’s not ok that the health and wellbeing of hundreds of thousands of us is being harmed by homelessness. But it doesn’t have to be this way!
4. Homelessness can be ended
The final thing I want to share about homelessness is that it can and must be ended. This isn’t me being optimistic or naïve. This is something that is entirely achievable – but it requires political commitment as well as support from people like you.
My Grandma was born in 1924 – four years before women in the UK had the same voting rights as men. As a queer person, I grew up thinking I’d never be able to marry someone that I love. We decided as a society that things could be different.
And we can do the same with homelessness.
We know what needs to be done - just like we did with voting rights, and with equal marriage. We need to build more truly affordable homes and provide more support for those of us at the brink. The more of us who come together to demand this change, the louder our voice will be heard.