
Is your home ‘earning’ more than you?
One in five homes has increased in value by more than the average salary in the past year alone. Is it time to check how much your home could be worth?
If you're a homeowner, you could be in for a surprise.
And that’s because one in five homes has ‘earned’ more money by simply existing as bricks and mortar than the average worker has in the past year alone.
In other words, 4.6m privately-owned homes have jumped in value by more than £30,500, the average UK salary, in the past 12 months, our latest research shows.
Want to find out what proportion of homes have increased in value by more than the average salary in your area? Check out our handy tool.
What could this mean for you?
If you are thinking of moving, you may be surprised by how much your home is now worth, particularly if you want to trade up the property ladder.
“I’ve worked out that the amount we earned on our apartment is close to my salary and this enabled us to purchase a larger apartment”
Russell Maddison, 39 years old, and his wife Hyun Kim (known as Helen), currently live in Barratt London’s Hendon Waterside development in north London.
Just three years after purchasing their one-bedroom apartment, the couple has purchased a larger two-bedroom property in the same development. Maddison explains how.
"We were quite keen on moving into a regeneration area as it helped with our budget, and we did our research, looked at the plans and considered the potential of the whole area, not just what we could see at the time.
"The decision certainly paid off, because just three years later the one-bedroom apartment we had bought for £202,000 was now worth £320,000, thanks mainly to the boost in prices caused by the regeneration of the area.
"I’ve even worked out that the amount we earned on our apartment is close to my salary and this enabled us to purchase a larger two-bedroom apartment in the same development for £465,000.
"It’s a great feeling when you see the prices going up when you have bought at an early stage. But you do have to have a careful eye, you need to be able to see ahead, look at the plans and what is there in the pipeline and try to visualise the end product."
Top 10 areas where homes have ‘earned’ more than the average salary
| Area | Average salary | Average property value | Percentage of homes that have risen in value by more than the average salary in the past year | Number of homes that have risen in value by more than the average salary in the past year |
|---|---|---|---|---|
| Hastings, East Sussex | £25,800 | £285,000 | 62% | 18,000 |
| Adur, East Sussex | £26,700 | £382,000 | 60% | 14,000 |
| Mole Valley, Surrey | £30,400 | £649,000 | 54% | 17,000 |
| Rother, East Sussex | £27,200 | £358,000 | 51% | 21,000 |
| Dorset | £28,000 | £352,000 | 47% | 71,000 |
| St Albans, Hertfordshire | £42,600 | £663,000 | 46% | 24,000 |
| Cotswold, Gloucestershire | £29,900 | £442,000 | 46% | 21,000 |
| Sevenoaks, Kent | £35,300 | £501,000 | 45% | 24,000 |
| Bromley, south east London | £41,900 | £552,000 | 45% | 51,000 |
| South Lakeland, Cumbria | £27,900 | £295,000 | 45% | 21,000 |
Research
Hastings in East Sussex has topped the ranking with the highest proportion of properties that have increased in value by more than the average pay packet during the past year at 62%, followed by Adur, also in East Sussex, at 60%.
The strong house price rises in these locations reflect the current trend among homeowners to relocate from urban to more rural areas during the pandemic.
Coastal locations were also popular, with 47% of properties in Dorset recording value increases that outstripped average salaries, while the rural locations of the Cotswolds and South Lakeland also made it into the top 10.
Another trend was strong price rises in commuter hotspots, with 54% of properties in Mole Valley, Surrey, increasing in price by more than the average salary, as did 46% of homes in St Albans and 45% in both Sevenoaks in Kent, and Bromley, south east London.
The regional picture
| Region | Average salary | Average property value | Percentage of homes that have risen in value by more than the average salary in the past year | Number of homes that have risen in value by more than the average salary in the past year |
|---|---|---|---|---|
| South east | £32,900 | £379,000 | 28% | 927,000 |
| London | £37,300 | £521,000 | 24% | 625,000 |
| South west | £29,000 | £300,000 | 29% | 620,000 |
| East of England | £31,500 | £333,000 | 23% | 514,000 |
| North west | £27,800 | £189,000 | 18% | 474,000 |
| Yorkshire & the Humber | £28,700 | £183,000 | 17% | 321,000 |
| East Midlands | £28,100 | £224,000 | 17% | 294,000 |
| West Midlands | £30,200 | £218,000 | 14% | 289,000 |
| Wales | £28,200 | £188,000 | 22% | 256,000 |
| Scotland | £34,100 | £168,000 | 9% | 165,000 |
| North east | £33,700 | £144,000 | 9% | 88,000 |
| UK | £30,500 | £265,000 | 21% | 4.6m |
Homes in the south west were most likely to see price rises that outstripped the average salary at 29%, followed by the south east at 28%.
Nearly one in four homes in London also increased in value by more than local pay during the past year, despite the fact that salaries in the capital are the highest in the UK at an average of £37,300.
Although house price growth in northern regions has been strong in percentage terms during the past year, the lower average values of properties there meant the gains have been lower in monetary terms.
Even so, nearly one in five properties in the north west saw price gains that outstripped average local pay.
Why is this happening?
Demand from potential buyers has been strong since the housing market reopened after the first national lockdown, with buyers looking for more space and a different lifestyle as they no longer had to commute to work on a daily basis.
The stamp duty holiday has also helped to fuel momentum in the housing market.
Our Head of research, said: "Hundreds of thousands of households have made the move into their new home over the last year.
"But activity has been so high, it has eroded the stock of homes for sale, which has put upward pressure on house prices, with values rising by up to 9% in some parts of the country."

1.8m homes pushed into higher stamp duty bands
Some buyers are set to fork out thousands of pounds more in stamp duty once the tax break draws to a complete close at the end of September. Could you be one of them?
Soaring house price growth has pushed more than 1.8m homes in England into higher stamp duty bands.
House prices have jumped by more than £10,000 during the past year as the scramble for homes continues.
And this house price growth is having a knock-on effect on stamp duty bills because the tax is based on a property’s price. It is charged on a tiered basis so buyers only pay the higher rates on the slice above any threshold – the same as income tax.
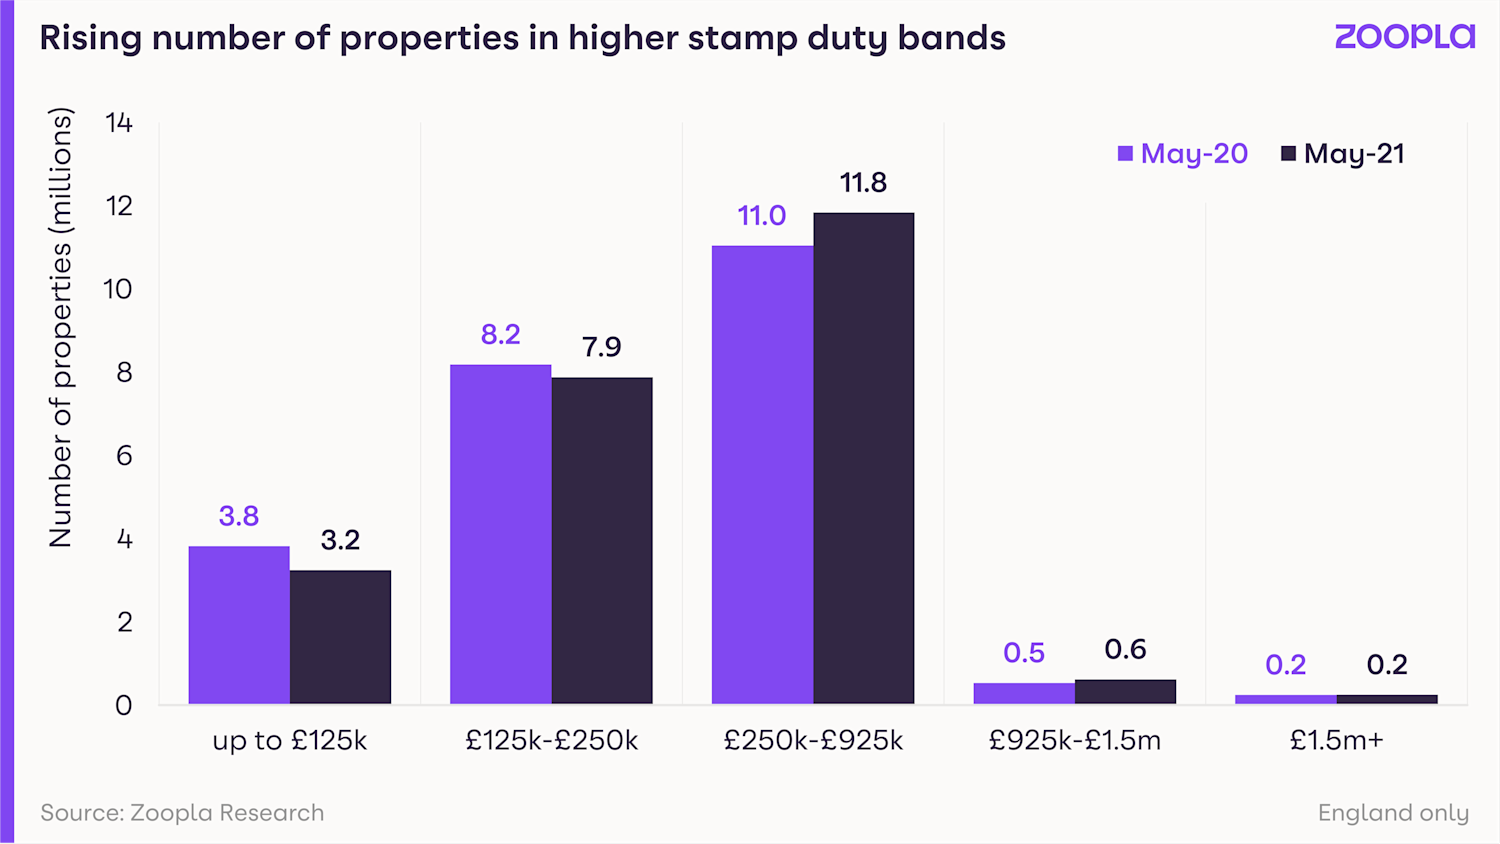
An estimated 940,000 properties have moved into the 5% stamp duty band, while 130,000 have moved into the 10% one.
At the same time, the number of homes in the lower stamp duty bands is falling.
Find out more about how stamp duty works further down this article.
What could this mean for you?
Put simply, some buyers face a bigger stamp duty bill.
Buyers purchasing a home that has moved into the 5% band face an additional cost of £725 on average once the tapered stamp duty holiday ends on 30 September.
Meanwhile those buying a property that has moved into the 10% band could expect to pay £6,100 more.
The situation should have less impact on first-time buyers, as they do not pay the tax on the first £300,000 of a property purchase, as long as the home they are buying does not cost more than £500,000.
But the strong house price rises seen during the past year could still make it harder for first-time buyers to get onto the property ladder, as affordability may be more stretched, and they will need a bigger deposit.
Why is this happening?
The housing market has been booming during the past year due to a combination of the stamp duty holiday and successive lockdowns causing people to re-evaluate the type of home they want to live in.
Our latest House Price Index shows that annual house price growth was running at 4.7% in May, more than double the rate of 2.2% seen in the same month last year.
The strong price growth has added £10,246 to the value of the typical home, enough to push many properties into a higher stamp duty band.
The lowdown on stamp duty
Buyers pay stamp duty when purchasing a property in England or Northern Ireland.
Last year, the Chancellor introduced a stamp duty holiday on properties costing up to £500,000. Although this has now ended, the threshold at which the tax kicks in will remain at £250,001 until 30 September 2021.
After this date, no stamp duty will be charged on the first £125,000 of a purchase, with the tax charged at:
- 2% on the portion from £125,001 to £250,000
- 5% on the portion from £250,001 to £925,000
- 10% on the portion from £925,000 to £1.5m
- 12% on the portion above £1.5m
It's worth remembering that stamp duty rates in England and Northern Ireland are different for first-time buyers and people buying additional property.
Top three takeaways
- Strong house price growth has pushed more than 1.8m homes in England into a higher stamp duty bracket during the past year
- Buyers purchasing a home that has moved into the 5% band face an additional cost of £725 on average once the tapered stamp duty holiday ends on 30 September.
- Meanwhile those buying a property that has moved into the 10% band could expect to pay £6,100 more.